
Mapping the Landscape of Human Illness: A Network Analysis of Disease Comorbidity in China
Analysis of disease comorbidity patterns in a large-scale China population.
This study constructs a large-scale Disease Comorbidity Network (DCN) analyzing 8.57 million clinical cases from 453 hospitals in China. By utilizing the FP-Growth algorithm and complex network metrics, the authors identified 5,702 diseases and 258,535 significant comorbidity edges, uncovering a hierarchical modular structure in the Chinese population's disease patterns.
TL;DR
Researchers have mapped the "social network" of diseases across 8.5 million patients in China. By treating diseases as nodes and their co-occurrence as links, the study reveals that the Chinese disease landscape is a hierarchical modular network. This means that while most diseases are isolated, a few "hub" conditions like hypertension act as massive intersections, linking diverse medical modules.
Background: Why Local Data Matters
For decades, our understanding of how diseases "travel in pairs" (comorbidity) has been heavily influenced by Western datasets. However, genetics, diet, and environment play massive roles in how illnesses interact. This study bridges the gap by analyzing a massive anonymized dataset from 453 Chinese hospitals, providing a localized blueprint for better diagnosis and chronic disease management.
Problem & Motivation: The Complexity of Multiple Illnesses
When a patient has multiple conditions, traditional "one-size-fits-all" treatments fail. Polypharmacy (taking multiple drugs) often leads to dangerous side effects. The authors argue that we cannot fix this without understanding the underlying topological structure of these disease relationships—moving beyond simple statistics to a complex network perspective.
Methodology: Building the Disease Comorbidity Network (DCN)
The team utilized clinical diagnostic information represented by four-digit ICD-10 codes.
- Mining Co-occurrence: They used the FP-Growth algorithm to find diseases that appear together more often than chance (governed by Relative Risk > 1).
- Network Topology: Every disease became a node. If two diseases were significantly correlated, an edge was drawn between them.
- Metrics: They measured how "central" a disease is (Degree/Betweenness) and how "clumped" the neighbors are (Clustering Coefficient).
 Figure 1: The conceptual framework of constructing the Disease Comorbidity Network from hospital-scale data.
Key Insights: Scale-Free and Hierarchical
The research yielded several profound findings:
- The Power-Law Reality: The network is "scale-free." A few diseases (hypertensions, anemia) are hubs with hundreds of connections, while most have very few.
- The Hierarchy of Hubs: There is a negative correlation between a node's degree and its clustering coefficient (). This suggests that while a hub like hypertension is connected to many diseases, those diseases aren't necessarily connected to each other—meaning hypertension bridges different functional "modules" of the body.
- Community Detection: Using the BGLL algorithm, the network was split into 10 modules. Interestingly, these modules aren't just single-category (like "eye diseases"); they often contain "intruder" diseases from other categories that are biologically linked (e.g., cataracts leading to unexpected comorbidities).
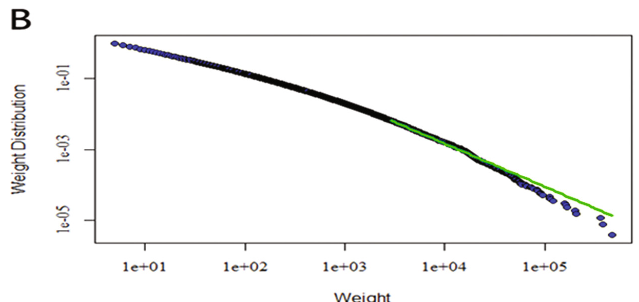 Figure 2: Statistical distributions of the DCN, showing the power-law nature of disease weight and degree.
Deep Dive: The Role of Hypertension
One of the most striking examples in the paper is Hypertension. It shows high Betweenness Centrality (BC) and a low Clustering Coefficient ().
- What this means: Hypertension acts as a "bridge" in the network. Because its neighbors are sparse and not well-connected to each other, it suggests that hypertension has diverse mechanisms that can trigger entirely different pathological pathways.
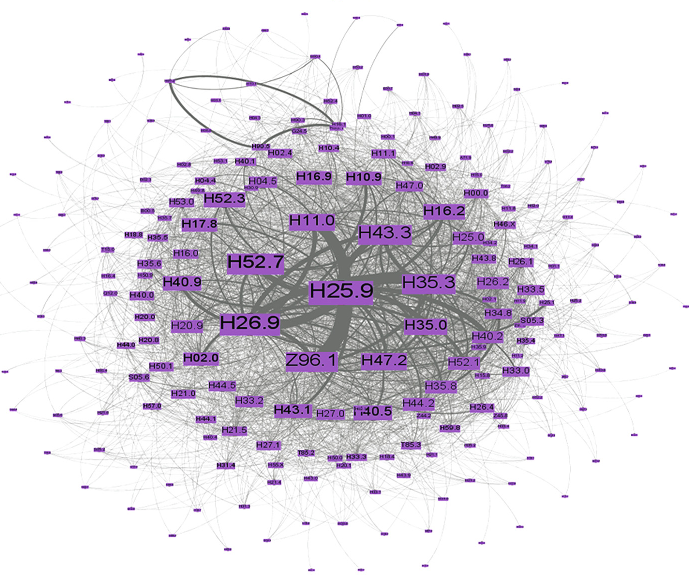 Figure 3: Comparisons between topological measurements (Degree, CC1, BC) revealing the modular structure of the network.
Critical Analysis & Future Outlook
Takeaway: This study proves that disease comorbidity is not random; it follows a strict hierarchical architecture.
Limitations: The authors acknowledge that clinical practitioners often only record the "primary" diagnosis, potentially leading to incomplete data. Furthermore, the temporal order of diseases (which came first?) was not the focus here.
Future Work: The next frontier involves integrating this clinical network with molecular networks (protein-protein interactions). If we can map clinical comorbidities to shared genetic pathways, we can move toward truly personalized medicine.