
Strategizing DNIDS Deployment: Leveraging Social Topology to Halt Malware Propagation
Deployment of DNIDS in Social Networks
The paper proposes a novel framework for deploying Distributed Network Intrusion Detection Systems (DNIDS) in social networks to mitigate worm and virus propagation. By leveraging Group Betweenness Centrality (GBC) with a greedy maximization algorithm, the authors identify influential users whose traffic, when monitored and cleaned, significantly slows down epidemic spread across the entire network.
TL;DR
Researchers have developed a framework that identifies the "central" users in a social network—not by how many friends they have, but by how much traffic flows through them. By deploying Distributed Network Intrusion Detection Systems (DNIDS) to monitor just a small, influential group identified via Group Betweenness Centrality (GBC), they can reduce network-wide infection levels by over 700%.
Background: The Social Highway of Malware
Computer worms and viruses are no longer just random probes; they exploit the inherent trust and connectivity of social networks (Emails, IMs). While we cannot monitor every byte of data on the internet due to privacy and hardware constraints, we can be strategic. The authors argue that the "epidemic threshold" of a network can be altered not by mass immunization, but by protecting the "bridges" of the network.
The Problem with Hubs
Prior work often focused on "hubs"—users with the highest number of connections (Degree Centrality). However, in a directed social network, a user might have many connections but sit on the periphery of the actual information flow. The real challenge is finding a group of users that collectively cover the maximum number of shortest paths between all other users.
Methodology: The GBC Framework
The framework operates in a cycle of extraction, identification, and simulation:
- Social Graph Extraction: Data is derived from real-world email logs. For this study, a network of 942 students was mapped, defining edges as email exchanges.
- Greedy GBC Maximization: Since finding the absolute optimal group for GBC is NP-hard, the authors use a greedy algorithm. It incrementally adds users who provide the highest marginal increase to the group's total centrality.
- SIRS Simulation: A custom-built simulator uses the Susceptible-Infective-Removed-Susceptible model. Unlike standard models, the 'Removed' state (crashed computer) is temporary, eventually returning to 'Susceptible' after repair.
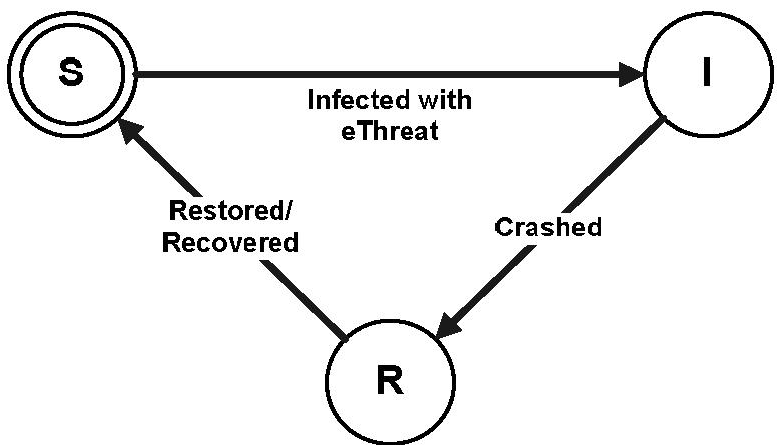 Fig 1: The SIRS state transition model used to simulate real-world computer infection and recovery cycles.
Key Insights from Experiments
The authors compared three strategies: Greedy GBC, TopBC (individual betweenness), and Random Deployment.
1. Superior Infection Control
The GBC strategy consistently maintained a lower percentage of "Infected or Crashed" computers. As more DNIDS units were deployed to the central group, the "cleansing" effect propagated throughout the network because the majority of malware-carrying messages were intercepted at these critical bottlenecks.
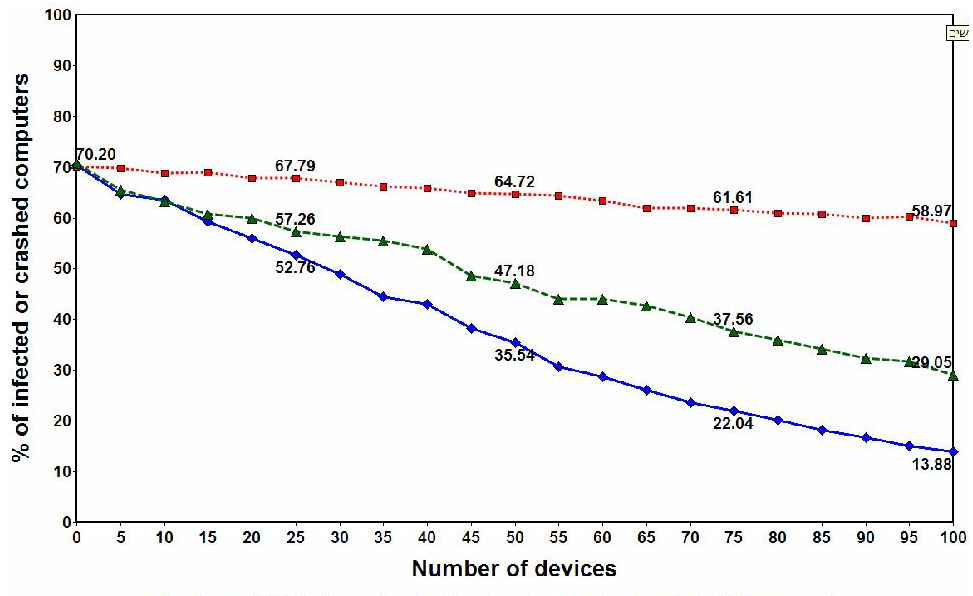 Fig 2: Comparison of GBC vs. Random and TopBC. GBC (solid line) shows a much steeper decline in infection rates as deployment grows.
2. Rapid Threat Detection
One of the most critical metrics in cybersecurity is the "Time to Detect." By monitoring central users, the DNIDS is more likely to encounter a new threat early in its propagation cycle. The simulation showed that even a small deployment of 5 devices in a central group could catch new threat classes significantly faster than random placement.
Critical Analysis & Conclusion
This work shifts the focus from "protecting everyone" to "protecting the right ones."
- The "Why" it Works: GBC is a more holistic measure than individual centrality. It accounts for the redundancy in paths—if User A and User B cover the same paths, GBC will pick User A and then look for a User C who covers different paths, whereas TopBC might redundantly pick both A and B.
- Limitations: The computational cost of GBC is , which makes it difficult to apply to massive networks like Facebook or X without approximation or graph partitioning.
- Future Outlook: Integrating dynamic social graphs (where connections change hourly) and leveraging ISP-level traffic metadata could turn this theoretical framework into a real-time defense layer for modern digital communities.
Takeaway: In the war against self-propagating malware, social topology is as important as the code itself.