
HBRG: Navigating the Danger Zone of Cyber-Physical Social Systems
Dynamic Security Risk Evaluation via Hybrid Bayesian Risk Graph in Cyber-Physical Social Systems
This paper introduces a Hybrid Bayesian Risk Graph (HBRG) model for dynamic security evaluation in Cyber-Physical Social Systems (CPSS). The framework integrates Hidden Markov Models (HMM) to capture temporal activity patterns with a layered Bayesian Risk Graph (BRG) to assess multi-level risk propagation.
TL;DR
As social networks merge with physical infrastructure (CPSS), traditional static security models are becoming obsolete. This paper introduces the Hybrid Bayesian Risk Graph (HBRG), a dual-layer framework that uses Hidden Markov Models (HMM) to track the "pulse" of user behavior and Bayesian networks to calculate how one suspicious "like" can escalate into a full-scale identity theft.
Background Positioning
This work resides at the intersection of Behavioral Informatics and Network Security. It moves beyond simple signature-based detection (looking for known viruses) to a probabilistic causal analysis of how user interactions actually lead to system-wide compromises.
Problem & Motivation: The "Weaponization" of Trust
Modern attackers don't just hack servers; they hack social relationships. The authors identify three critical gaps in current security:
- False Accounts: 2-5% of major social platform users are fraudulent.
- Scam Effectiveness: Professional users spot less than 20% of modern social scams.
- The Neighbor Influence: Your risk level isn't just about what you do; it's about what your friends reshare.
Existing models treat users in a vacuum. This paper argues that risk is dynamic and contagious.
Methodology: The Two-Layer Shield
The core of the HBRG is its two-layer architecture designed to handle both temporal dynamics and causal relationships.
1. The Bottom Layer: HMM for Activity Evolution
Since user intent is unobservable (a "hidden" state), the HMM treats user activities (tweets, timestamps, replies) as emissions. Crucially, the transition probability—whether a user moves from a "safe" to an "at-risk" state—is modified by the Influence of Neighbors (Z).
2. The Top Layer: The Bayesian Risk Graph (BRG)
The output of the HMMs feeds into a BRG, which categorizes risks into three hierarchies:
- Behavior Risk: High-level patterns (e.g., profile mining).
- Dynamic Risk: Active attempts to compromise security.
- Static Risk: Fixed vulnerabilities like malware payloads.
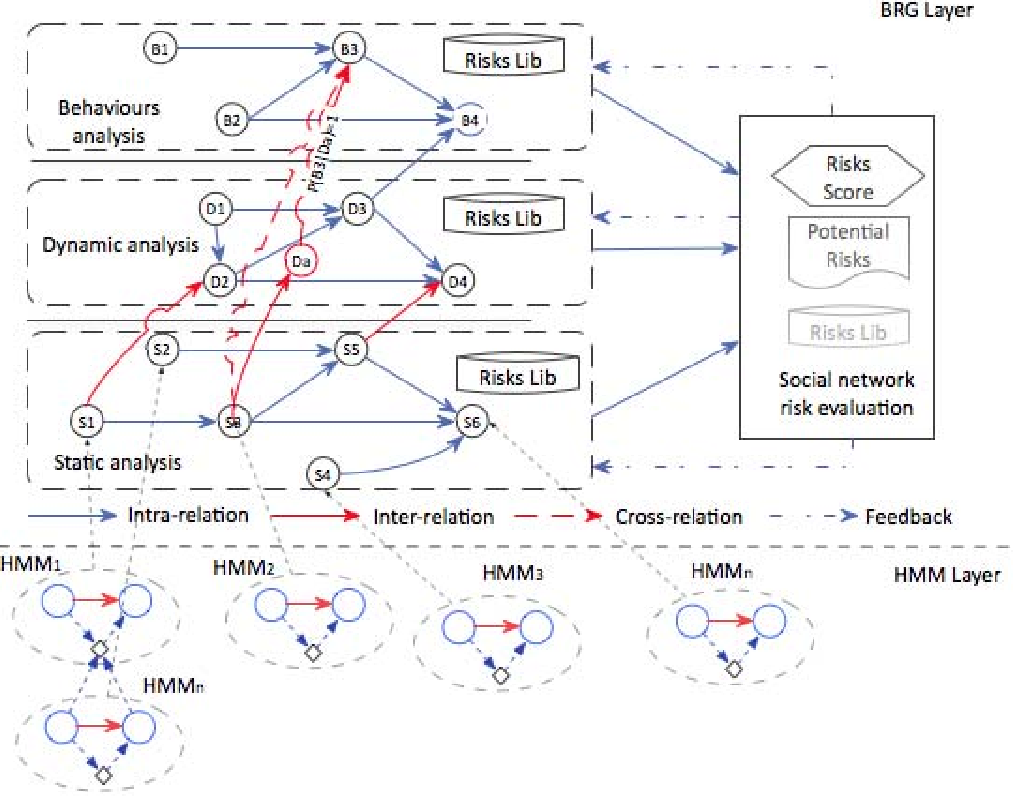
The figure above illustrates the interconnected nature of the HMM and BRG layers.
Experiments & Results: Real-world Twitter Defense
The authors tested the model using a Twitter stream API during a 10-day period in 2017. They categorized nine common attacks, including Like-jacking, Evil Twin attacks, and Cyberbullying.
SOTA Comparison & Quantification
Using a dynamic Conditional Probability Table (CPT), the model was able to quantify risk with high precision. For a "Fake Follower" scenario:
- With 100% confirmation of sub-attacks, the risk was 97.3%.
- Even with partial/mid-level evidence of a profile attack, the system maintained a robust detection rate of ~58-64%.
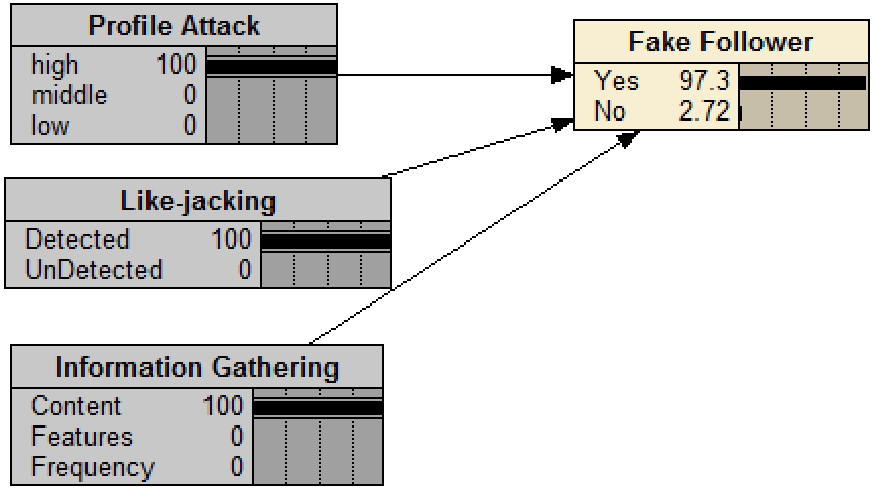
This visualization shows how various 'atomic risks' (like Information Gathering) propagate through the graph to alert the user of a Compound Risk.
Critical Analysis & Conclusion
The Takeaway
The HBRG model successfully bridges the gap between raw activity data and high-level risk assessment. Its biggest strength is the Node Mapping Scheme, which allows unmanaged social data to be converted into structured, actionable security intelligence.
Limitations & Future Work
While the HMM handles temporal data well, the computational complexity of the Bayesian cross-network links could grow exponentially as social networks scale. Future research might look at sparse Bayesian learning or Graph Neural Networks (GNNs) to further optimize the CPT update frequency for real-time global monitoring.
Ultimately, this paper serves as a blueprint for the next generation of "Neighborhood Watch" systems in the digital age—where security is no longer just a firewall, but a dynamic interpretation of social behavior.