
The Seniority Factor: Unlocking Microscopic Evolution in Social Networks
Study of effect of node seniority in social networks
This paper introduces the Node Event Sequence (NES) framework for microscopic analysis of evolving social networks. Applied to the NanoSCI nanotechnology collaboration dataset, the study quantifies how "Node Seniority" influences community health, researcher retention, and the formation of new collaborative edges.
TL;DR
This study moves beyond static network "snapshots" by introducing Node Event Sequences (NES)—a chronological log of every action a node takes. By analyzing 26 years of nanotechnology research data, the authors demonstrate that Seniority is the engine of network growth: it dictates who stays, who leaves, and who forms the most valuable new connections.
Background: Beyond the Snapshot
Most social network research treats evolution as a series of still photos (snapshots). While great for seeing the "big picture"—like how the total number of users grows—it misses the microscopic evolution. We don't just want to know that a new edge was formed; we want to know why those two specific people connected at that specific point in their careers.
The authors argue that a researcher's behavior changes as they gain experience—moving from a protégé seeking guidance to a mentor providing it. To capture this, they propose the NES framework.
Methodology: Mapping the Life of a Node
The core innovation is the formal definition of a Node Event Sequence (NES). Unlike an edge sequence, an event (like a paper) can involve multiple nodes and rich metadata.
Key Metrics Defined:
- Seniority: The time elapsed since a node's first recorded event.
- Intervals: The time between consecutive events, used to determine if a node is still "alive."
- Lifetime: The total duration from join date to the last recorded activity.

By analyzing the distribution of intervals, the authors identified a 3-year threshold: if a researcher hasn't published in three years, they have likely left the community. This allows for a much cleaner analysis of "Active" vs. "Dead" nodes.
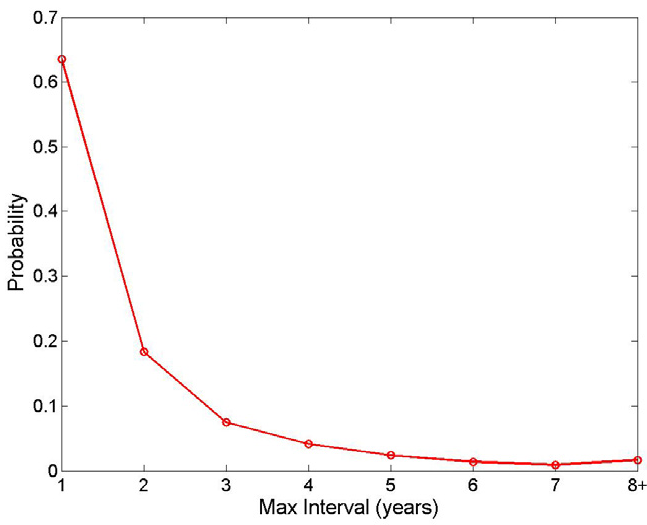 Fig 1: 90% of researchers have a maximum gap of years between activities, establishing the "active node" boundary.
Identifying the "Mentor-Protege" Engine
The study’s empirical findings on the NanoSCI dataset reveal a fascinatng dynamic in scientific communities:
- High Churn, Fresh Blood: About 80% of researchers leave after their first year (likely students). However, the community remains "healthy" because the number of new joiners is consistently high.
- Seniority Attracts: There is a direct correlation between seniority and the ability to attract new collaborators. Junior nodes rarely initiate new connections on their own.
- The 4-Year Gap: The most common seniority difference between the most senior and most junior author on a paper is 4 years. This suggests a structural pattern of senior researchers leading juniors into the field.
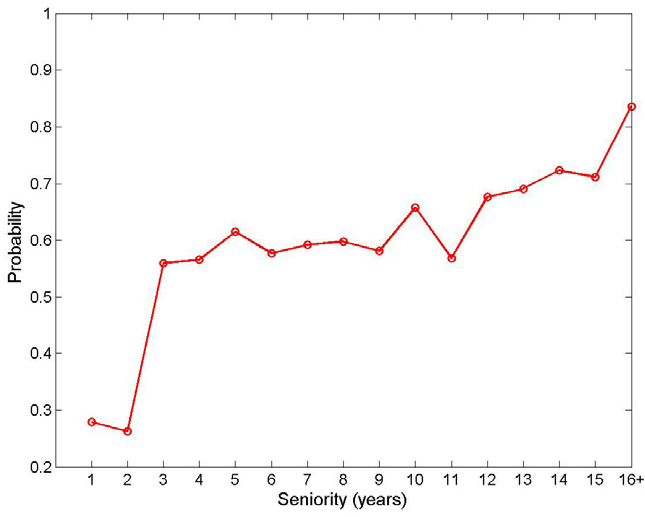 Fig 3: Seniority is a powerful predictor of a node's "attractiveness" for new connections.
Deep Insight: Why Seniority Matters
The "Rich-Get-Richer" (Preferential Attachment) model is a staple of network science, but this paper adds a temporal layer to it. It isn't just about having many edges; it's about the experience (Seniority) gained through the NES.
The transition from being "helped" to "helping" is the invisible force that sustains the network. Without the seniority gap shown in Figure 4, the transmission of knowledge between generations of researchers would stall, and the network would lose its structural integrity.
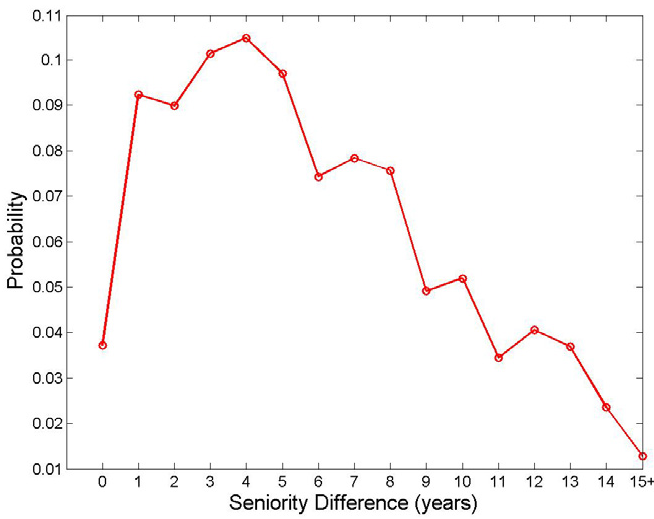 Fig 4: The 4-year seniority gap highlights the mentorship role essential for publication.
Critical Analysis & Future Outlook
While the paper provides a robust framework for professional networks, its "3-year rule" for inactivity is specific to the slow pace of academic publishing. In faster-moving social networks (like Twitter or LinkedIn), these event sequences would need to be measured in days or hours.
Future Work: The authors suggest using NES to study interest shifts. By looking at the type of events in a sequence, we could model how a person's expertise evolves from one sub-field to another, providing a roadmap for predicting the next big research trend before it hits the mainstream.
Takeaway: If you want to understand where a network is going, stop looking at the graph's shape and start looking at the "clocks" of the individuals within it.