
Identifying the "Champions": How Social Network Analysis Uncovers Emergent Leaders in CS Education
Identification of the Emergent Leaders within a CSE Professional Development Program
This study utilizes Social Network Analysis (SNA) to identify "emergent leaders" within a Computer Science Education (CSE) professional development program. By analyzing the collegial ties among 16 K-12 teachers, the researchers successfully pinpointed informal leaders who drive social capital and program sustainability, validating their findings through correlations with online course performance and the Key Player algorithm.
TL;DR
Building a sustainable Computer Science (CS) curriculum isn't just about training teachers in Python or Java—it's about the social infrastructure they build. This paper demonstrates how Social Network Analysis (SNA) can identify "emergent leaders" in a cohort of teachers. These leaders are the secret sauce for sustainability, acting as the bridges that keep information flowing and morale high long after the professional development (PD) workshops end.
The Problem: The "Singleton" Teacher Trap
Most K-12 Computer Science teachers are "singletons"—the only person in their entire building teaching the subject. This isolation is a death sentence for educational reform. When these teachers face pedagogical hurdles or technical bugs, they have no local support system.
While many PD programs focus on What to teach, they fail to address Who will lead the community. The authors argue that without identifying and empowering informal leaders—those who naturally share advice and materials without being told to—the "social capital" of the group remains low, and the innovation inevitably dies out.
Methodology: High-Resolution Social Mapping
The researchers tracked a cohort of 16 teachers (the SPARCS program) through a summer institute. They used SNA to move beyond formal hierarchies and map the Informal Path.
Key Metrics Used:
- Degree Centrality: How many unique connections does a teacher have? (The "Hub" effect).
- Betweenness Centrality: Does this teacher act as a bridge between two other unconnected groups? (The "Gatekeeper" effect).
- Member Excluded Density (MED): A clever "stress test" for the network. The researchers removed one teacher at a time and recalculated the network's density to see who caused the biggest collapse in connectivity.
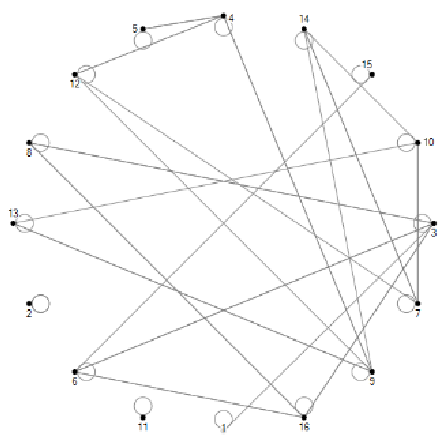 Figure 1: Comparison of network density before and after the summer institute, showing the growth of professional ties.
Why It Works: The "Willingness to Learn" Factor
One of the paper's most profound insights is the correlation between social influence and technical competence.
The data showed a significant correlation (-0.64) between high "collegiality" scores and performance on a CS online course. Interestingly, several "CS-experienced" teachers who entered the program with prior knowledge decreased the group's social capital because they didn't engage with others. In contrast, the identified emergent leader (Teacher 14) had both technical skills and a high "willingness to learn" about their peers.
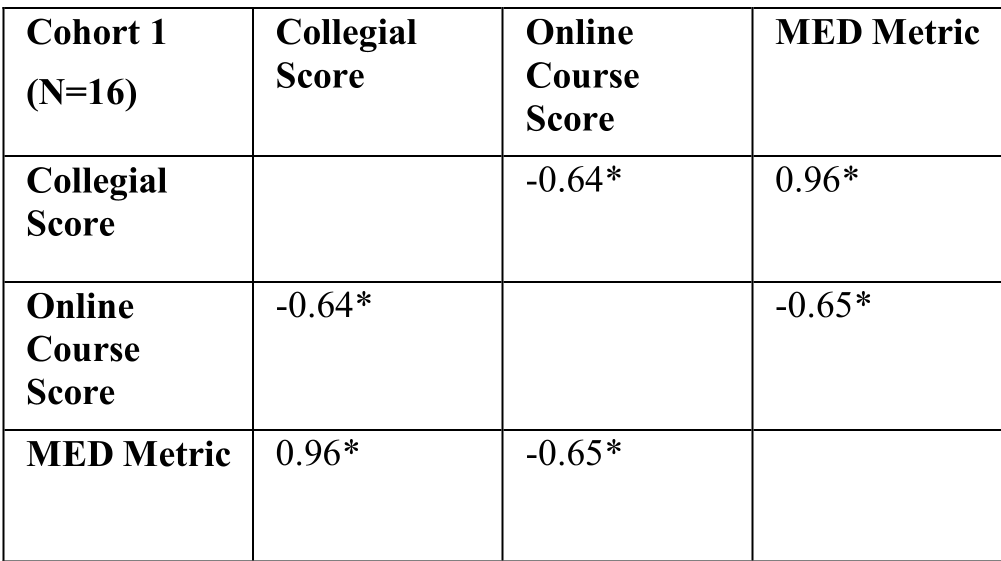 Table 2: Significant correlations between collegial scores, online course proficiency, and social capital contribution.
Critical Insights: Hubs vs. Gatekeepers
In Innovation Diffusion Theory, Hubs increase the scale of adoption, while Gatekeepers increase the rate. This study found that the best emergent leaders act as both.
- The Hub: Knows everyone, spreads materials fast.
- The Gatekeeper: Connects the math teachers to the science teachers, ensuring the CS curriculum doesn't stay siloed.
Conclusion & Future Outlook
This paper shifts the focus of CS professional development from a Human Capital model (what a teacher knows) to a Social Capital model (how teachers interact).
Takeaway for PD Designers: Don't just look for the best programmers to lead your sessions. Use SNA to identify those with high "betweenness"—the teachers who naturally bridge gaps. By empowering these "Key Players," we can ensure that the "CS for All" initiative isn't just a temporary trend, but a permanent shift in our educational landscape.
Limitations: With a N=16 sample size, the statistical power is limited, but the high p-values and validation via the Key Player algorithm suggest a robust methodology that scales to larger teacher networks.