
Beyond Single Labels: The Rise of Sentiment Quantification in Twitter
SPECIAL SECTION ON EMERGING TRENDS, ISSUES AND CHALLENGES FOR ARRAY SIGNAL PROCESSING AND ITS APPLICATIONS IN SMART CITY
This paper introduces "Sentiment Quantification," a novel task for Twitter sentiment analysis that identifies all co-existing sentiments within a single tweet rather than assigning a single label. The authors enhance their SENTA tool with "Advanced Pattern Features" and a secondary scoring mechanism, achieving an F1-score of 45.9% across 11 sentiment classes.
TL;DR
Researchers from Keio University argue that traditional classification is "obsolete" for complex social media posts. They propose Sentiment Quantification, a method designed to detect every emotion in a tweet (e.g., Happiness + Love + Relief) by using a scoring system based on advanced linguistic patterns. Using their updated tool, SENTA, they achieved a breakthrough in identifying nuanced emotional layers across 11 distinct classes.
The Problem: Why Classification Isn't Enough
In the world of Twitter, emotions are rarely "pure." A user complaining about a game update might be simultaneously frustrated, angry, and sad. Standard machine learning models, however, are usually trained for Multi-class Classification, which forces the model to pick just one dominant label.
The authors discovered a startling statistic: more than 55% of tweets in their dataset contained more than one sentiment. By forcing a single label, researchers lose nearly half of the emotional data.
The "Quantification" Insight
The core of this paper is the shift from "What is the label?" to "How much of each sentiment is present?" The authors introduce Advanced Pattern Features. Unlike simple word counts, these features look at the structure of a sentence. For example, a "Love" pattern might look like [PRONOUN + LOVE_VERB + ADJECTIVE].
The Methodology Pipeline
The process follows a logical flow to handle the complexity of 11 sentiment classes:
- Ternary Classification: First, the model decides if the tweet is Positive, Negative, or Neutral.
- Scoring: The model calculates three sub-scores for each potential sentiment:
- S_U (Unigram Score): Based on presence of specific emotional words.
- S_BP (Basic Pattern Score): Based on general syntactic structures.
- S_AP (Advanced Pattern Score): Based on refined, sentiment-aware linguistic patterns.
- Thresholding: Sentiments that pass a certain score threshold are assigned to the tweet.
 Figure 1: The overarching workflow from raw tweets to quantified sentiment scores.
Experimental Battleground
To test this, the authors used a manually labeled dataset of 11 sentiments (Fun, Enthusiasm, Happiness, Love, Relief for Positive; Anger, Boredom, Hate, Sadness, Worry for Negative).
Key Technical Findings:
- The Random Forest Edge: Among various classifiers (Naive Bayes, J48), Random Forest provided the most robust results for the initial polarity detection.
- Feature Importance: Interestingly, Advanced Patterns (ν) contributed significantly more to success than simple Unigrams (τ). This proves that how we say things (syntax) is more indicative of complex emotion than what words we use in isolation.
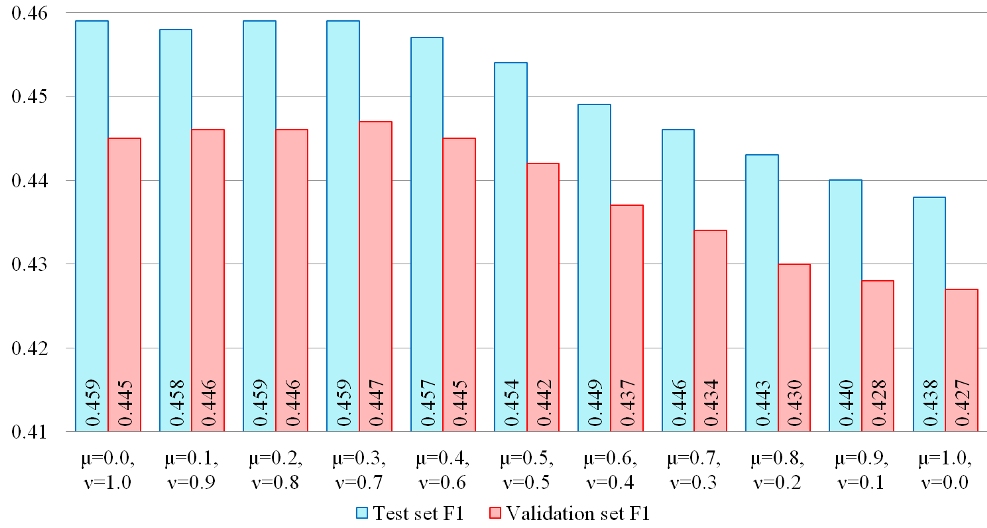 Figure 2: F1-Score distributions showing the impact of different feature weights on the quantification results.
Critical Analysis: Is it SOTA?
While an F1-score of 45.9% might seem low compared to simple binary tasks (which often hit 80-90%), it is actually quite impressive for a 11-class multi-label task. In human trials, even annotators only agree on these fine-grained labels about 67% of the time.
Limitations: The model currently assumes a tweet is either all positive or all negative. It discards "mixed-polarity" tweets (e.g., "I love the coffee but hate the price"). In the messy reality of the internet, solving the mixed-polarity puzzle is the next logical frontier.
Takeaway for the Industry
For companies monitoring brand health, this paper provides a blueprint for a more sophisticated "Emotional Dashboard." Instead of seeing "Score: 70% Positive," a brand manager could see "30% Happiness, 40% Relief, 10% Boredom," offering much deeper insight into customer experience.
Author Note: This work was published in IEEE Access (2018) and remains a foundational reference for those looking to move beyond "Sentiment Analysis 101."