
Beyond Happy and Sad: Refining Emotion Classification with 3D EEG Mapping
Emotion Classification Using EEG Signals
This paper introduces a 3D emotional model for classifying user emotions during music video consumption using EEG signals from the DEAP dataset. By expanding Russell's 2D model with a "Dominance" dimension, the authors achieved a classification accuracy of 78.06% using Naïve Bayes.
TL;DR
Researchers have developed a 3D emotional model that enhances EEG-based emotion recognition by adding Dominance to the classic Valence-Arousal framework. Utilizing the DEAP dataset and Naïve Bayes, the system achieves an impressive 78.06% accuracy, offering a more nuanced way to categorize how we feel while consuming digital content.
Background: The Limits of 2D Emotions
Most affective computing research relies on Russell's 2D model, which plots emotions on a grid of Valence (how pleasant) and Arousal (how intense). However, human psychology is deeper. For instance, both "Anger" and "Fear" might look similar on a 2D scale, but they differ significantly in terms of Dominance—the degree of control a user feels over their situation. This paper argues that without this third axis, we are missing the "why" behind the brain's electrical signals.
Methodology: Mapping the Brain in 3D
The authors leveraged the DEAP (Database for Emotion Analysis using Physiological Signals) dataset, which contains EEG data from 32 participants watching music videos.
- Preprocessing: Raw EEG signals (sampled at 512Hz) were downsampled and cleaned using wavelet-based functions to strip away muscle noise and artifacts.
- The 3D Octant System: By splitting Valence, Arousal, and Dominance into High/Low categories, the authors created 8 distinct "octants."
- Classification: They compared Naïve Bayes and Support Vector Machines (SVM) to see which could better predict these octants.
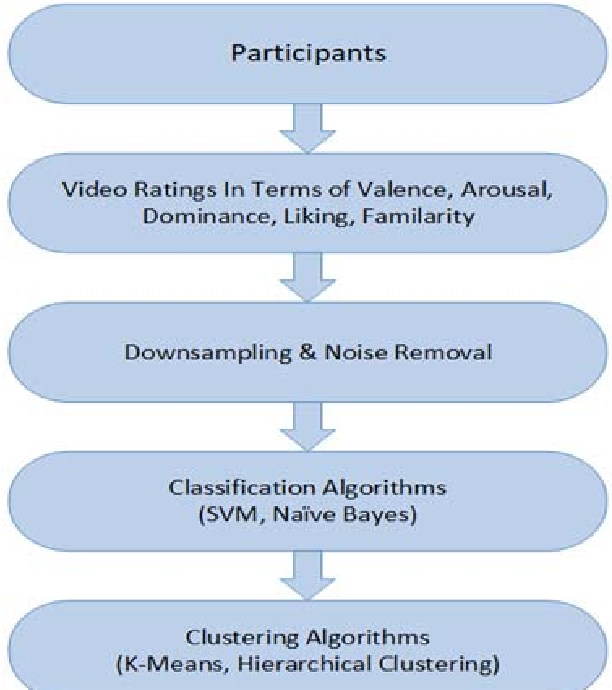 The workflow from signal acquisition to 3D emotional mapping.
Experimental Insights: Naïve Bayes Takes the Lead
The results showed a clear winner in the algorithmic battle. While SVM is often a favorite for high-dimensional data, Naïve Bayes reached 78.06% accuracy, significantly outperforming SVM’s 58.90%.
Key findings from the clustering analysis include:
- Excitement Dominates: 25% of participants fell into the "High Valence, High Arousal, High Dominance" (Excited) cluster.
- The Power of Dominance: The inclusion of dominance allowed for the classification of states like "Relaxed" vs. "Peaceful," which are often conflated in 2D models.
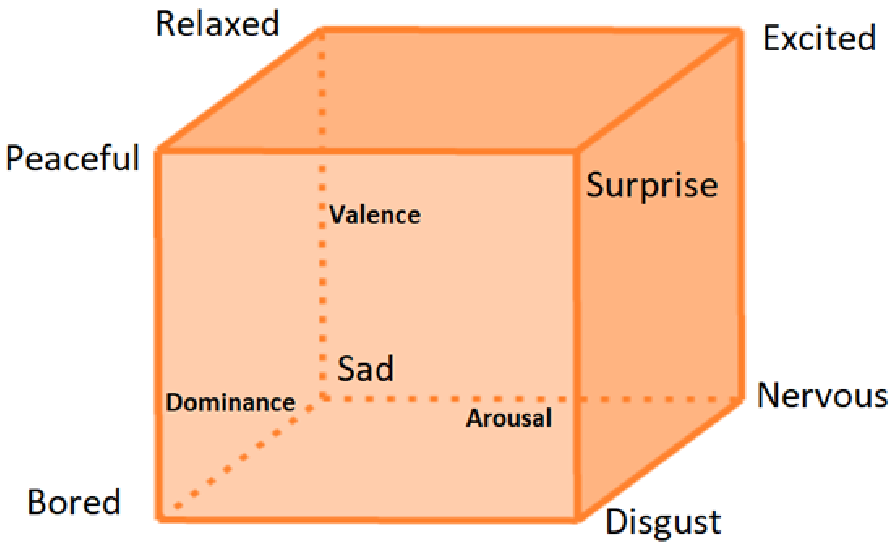 Visual representation of the 8 emotional states within the VAD space.
Critical Analysis & Conclusion
This work represents a vital step toward more "empathetic" AI. By moving to a 3D model, we gain the resolution needed for sensitive applications like Mental Health Monitoring (detecting depression) or E-Learning (identifying when a student feels "Bored" vs. "Nervous").
Limitations: The study relies on the Neurosky Mindwave (single-channel or low-channel count) logic for generalizability, but the DEAP dataset is 32-channel. High-density EEG is still required to pinpoint exactly where in the brain these emotions originate (localization), and the non-invasive nature of EEG remains prone to external noise.
Future Outlook: The next frontier is real-time application. Imagine a Spotify that doesn't just play "happy" music, but adjusts its queue because it detects you are feeling "Overwhelmed" (Low Dominance) rather than just "Sad." This 3D approach provides the mathematical foundation to make that possible.