
Beyond Vectors: Decoding Human Emotion via EEG Topographic Images and CNNs
Emotion recognition from EEG-based relative power spectral topography using convolutional neural network
The paper proposes a novel emotion recognition framework that transforms multichannel EEG signals into 2D topographic images based on Relative Power Spectral Density (RPSD). These images, capturing spatial and frequency domain information, are classified using a Convolutional Neural Network (CNN) into positive, negative, and neutral states on the SEED dataset.
TL;DR
Researchers have developed a high-precision system for human emotion recognition by converting 1D EEG signals into 2D Relative Power Spectral Density (RPSD) topographic images. By treating brain activity as a visual pattern, a Convolutional Neural Network (CNN) achieved a breakthrough 94.63% accuracy on the SEED dataset, significantly outperforming traditional shallow learning and standard PSD-based methods.
Background & Motivation: The Individual Variability Trap
Human emotion recognition is the "Holy Grail" of Affective Computing. While EEG is a gold standard for objective emotion measurement, it is notoriously "noisy." Traditional methods rely on manual feature extraction (Time/Frequency domains), often ignoring the spatial relationship between brain regions.
The authors identify two critical flaws in existing literature:
- Feature Hand-crafting: Selecting the right features is computationally expensive and requires deep domain expertise.
- PSD Instability: Most studies use Absolute Power Spectral Density (PSD), which fluctuates based on an individual's physiology or the hardware used, making cross-subject recognition difficult.
The Core Insight: Brain Activity as a Map
The researchers' breakthrough stems from two shifts in perspective:
- From PSD to RPSD: Instead of looking at absolute power, they look at the ratio of power in specific bands (3-30 Hz) relative to the total power. This normalizes the data, making features more stable across different people.
- From Vectors to Topography: Instead of a list of numbers, they project the electrode data onto a 9x8 grid representing the scalp's surface. This preserves the Inductive Bias that electrodes physically close to each other should have correlated activities.
1. The Architecture of Topography
The process involves capturing 62-channel EEG data, filtering it to the Alpha, Beta, and Gamma bands (8-32 Hz), and calculating the RPSD. Since the 10-20 system doesn't perfectly fit a rectangle, the authors used Natural Neighbor Interpolation to fill in the gaps, creating a smooth 192x192 RGB heat map.
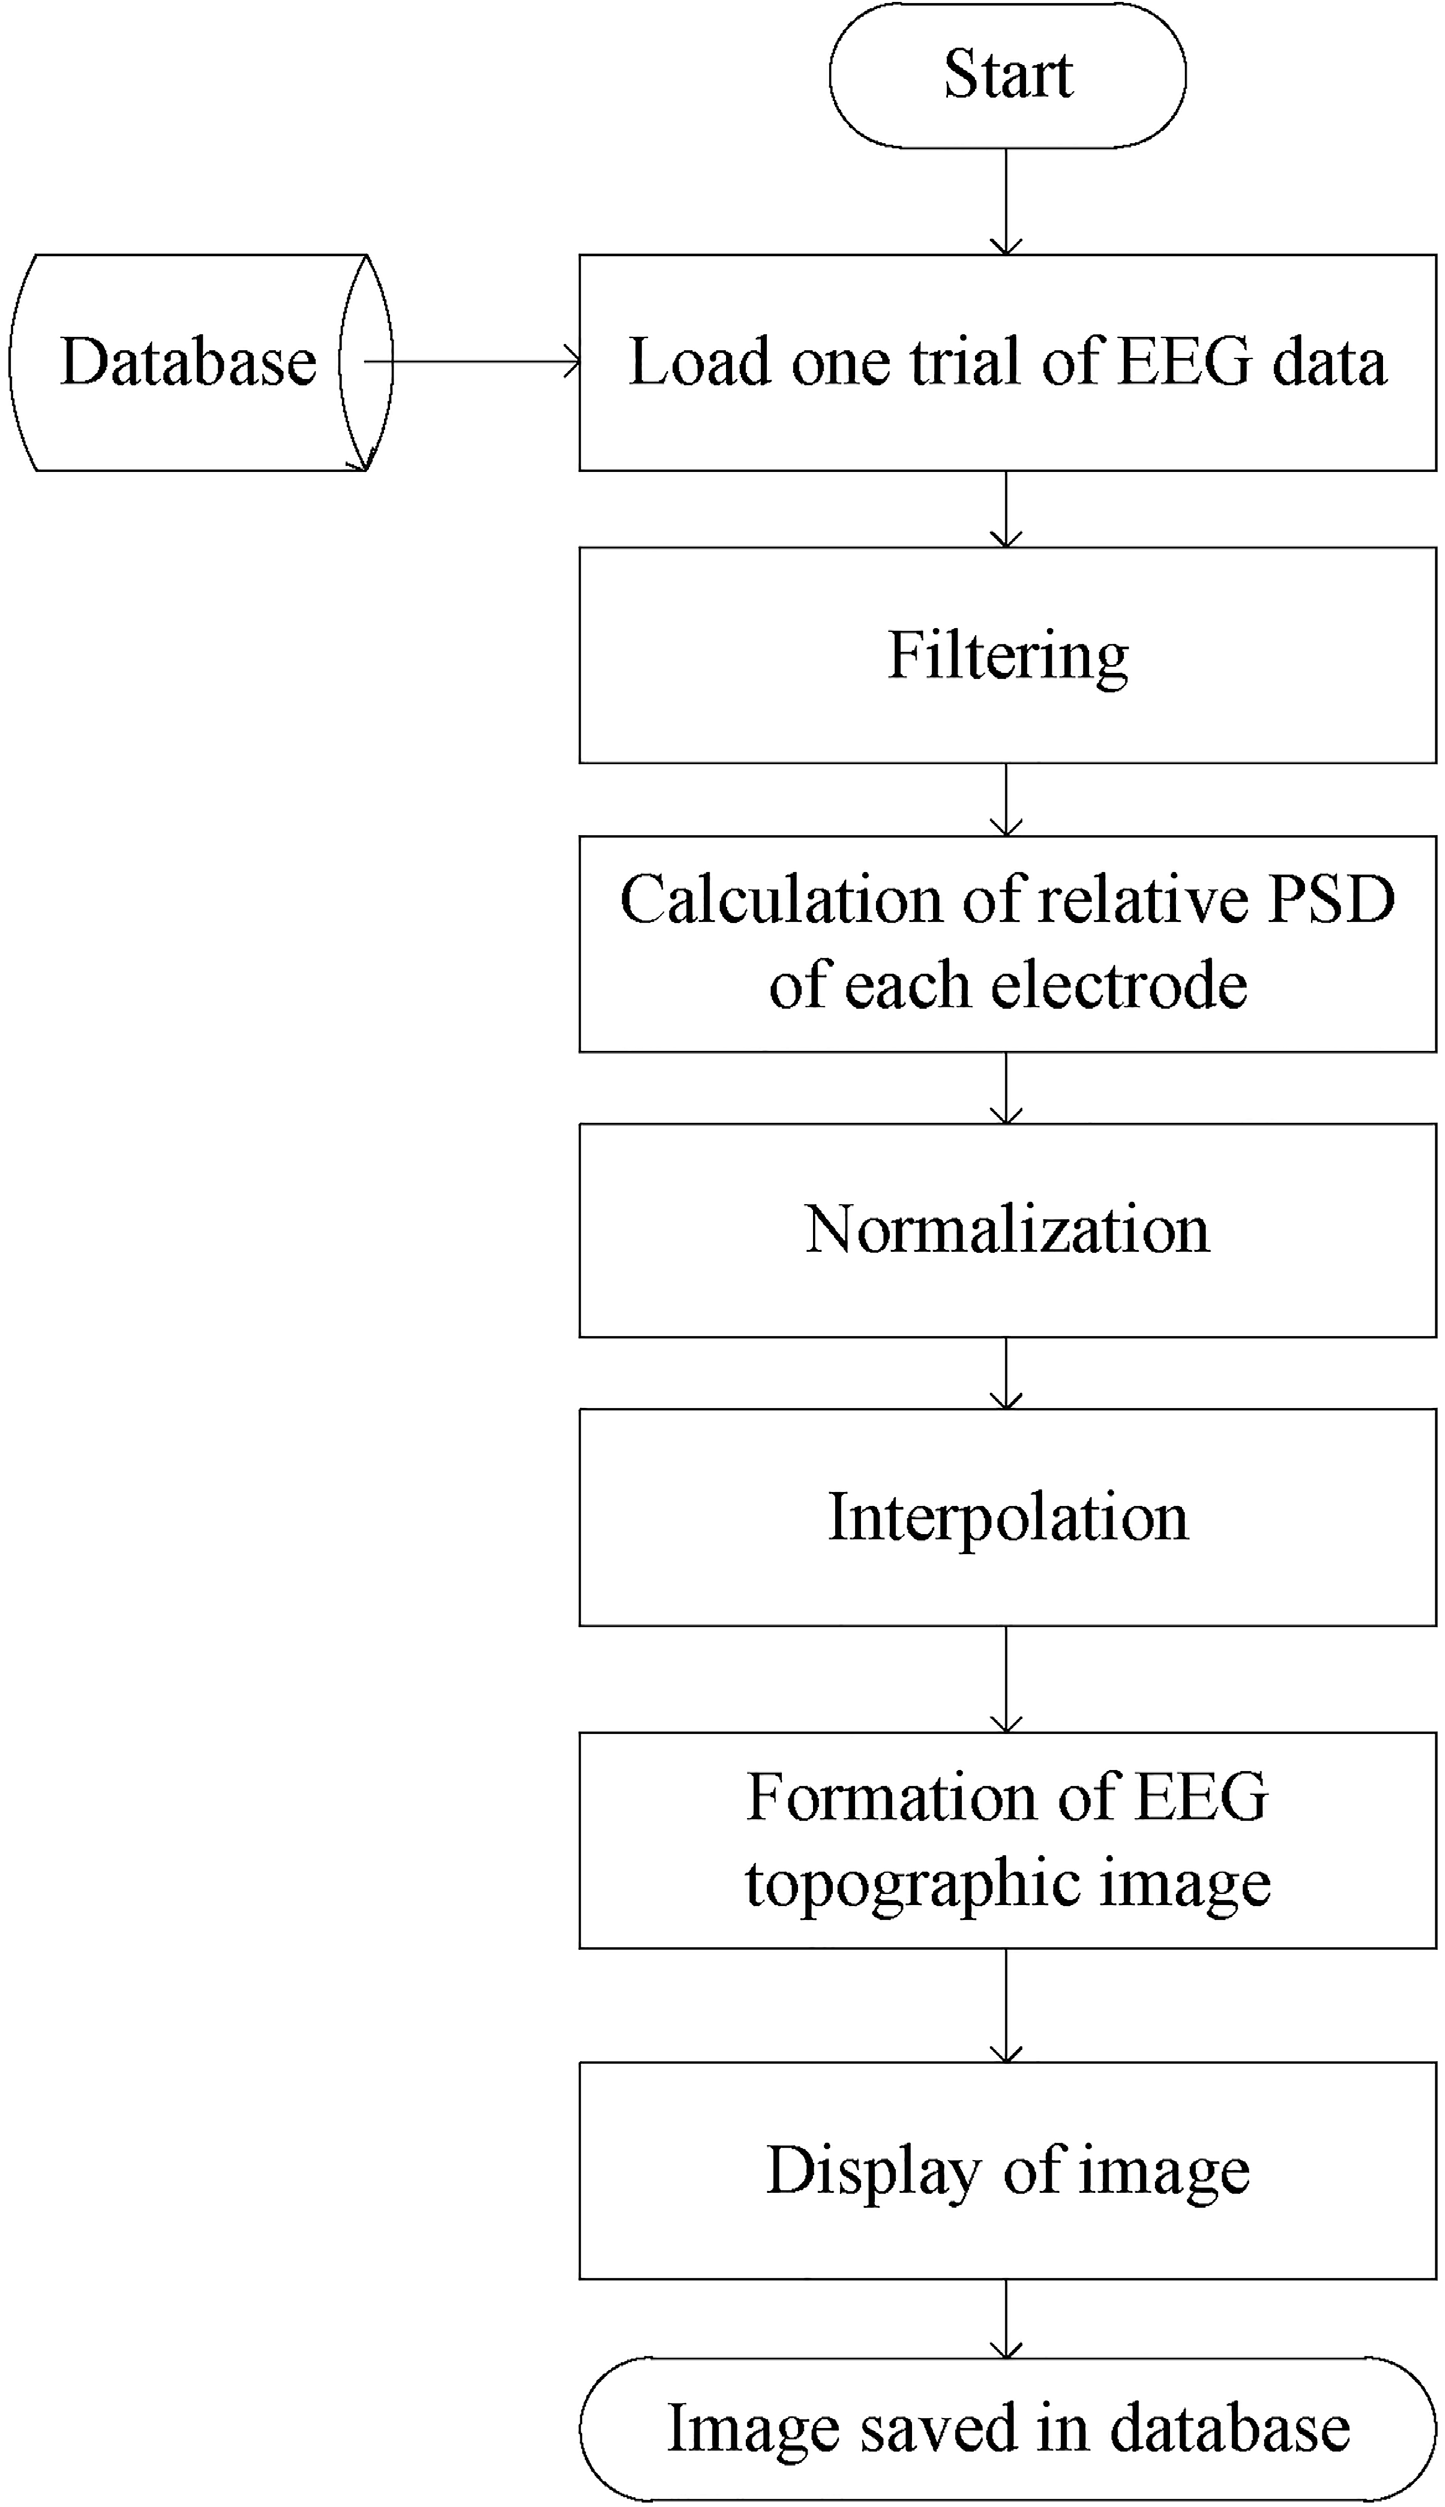 Figure 1: The pipeline from raw EEG to Topographic Image.
Methodology: Let the CNN Do the Heavy Lifting
The generated images are fed into a CNN. Unlike traditional Support Vector Machines (SVM), the CNN can learn hierarchical spatial features. For instance, it can detect patterns of "Frontal Asymmetry"—a known biological marker where positive and negative emotions show different activity levels in the left vs. right frontal lobes.
The architecture includes:
- Convolutional Layers: For spatial feature extraction.
- Batch Normalization: To speed up training and handle internal covariate shift.
- ReLU Activation: For non-linear mapping.
- Fully Connected Layer: Mapping the extracted features to three classes: Positive, Neutral, and Negative.
Experimental Showdown: Setting New Records
The system was tested on the SEED (SJTU Emotion EEG Dataset). The results were spectacular:
- Superior Stability: RPSD-based images showed much clearer differentiation between emotional states compared to standard PSD.
- High Performance: Even with only 25% of the data used for training, the model hit 89.06% accuracy. With 50% training data, it surged to 94.63%.
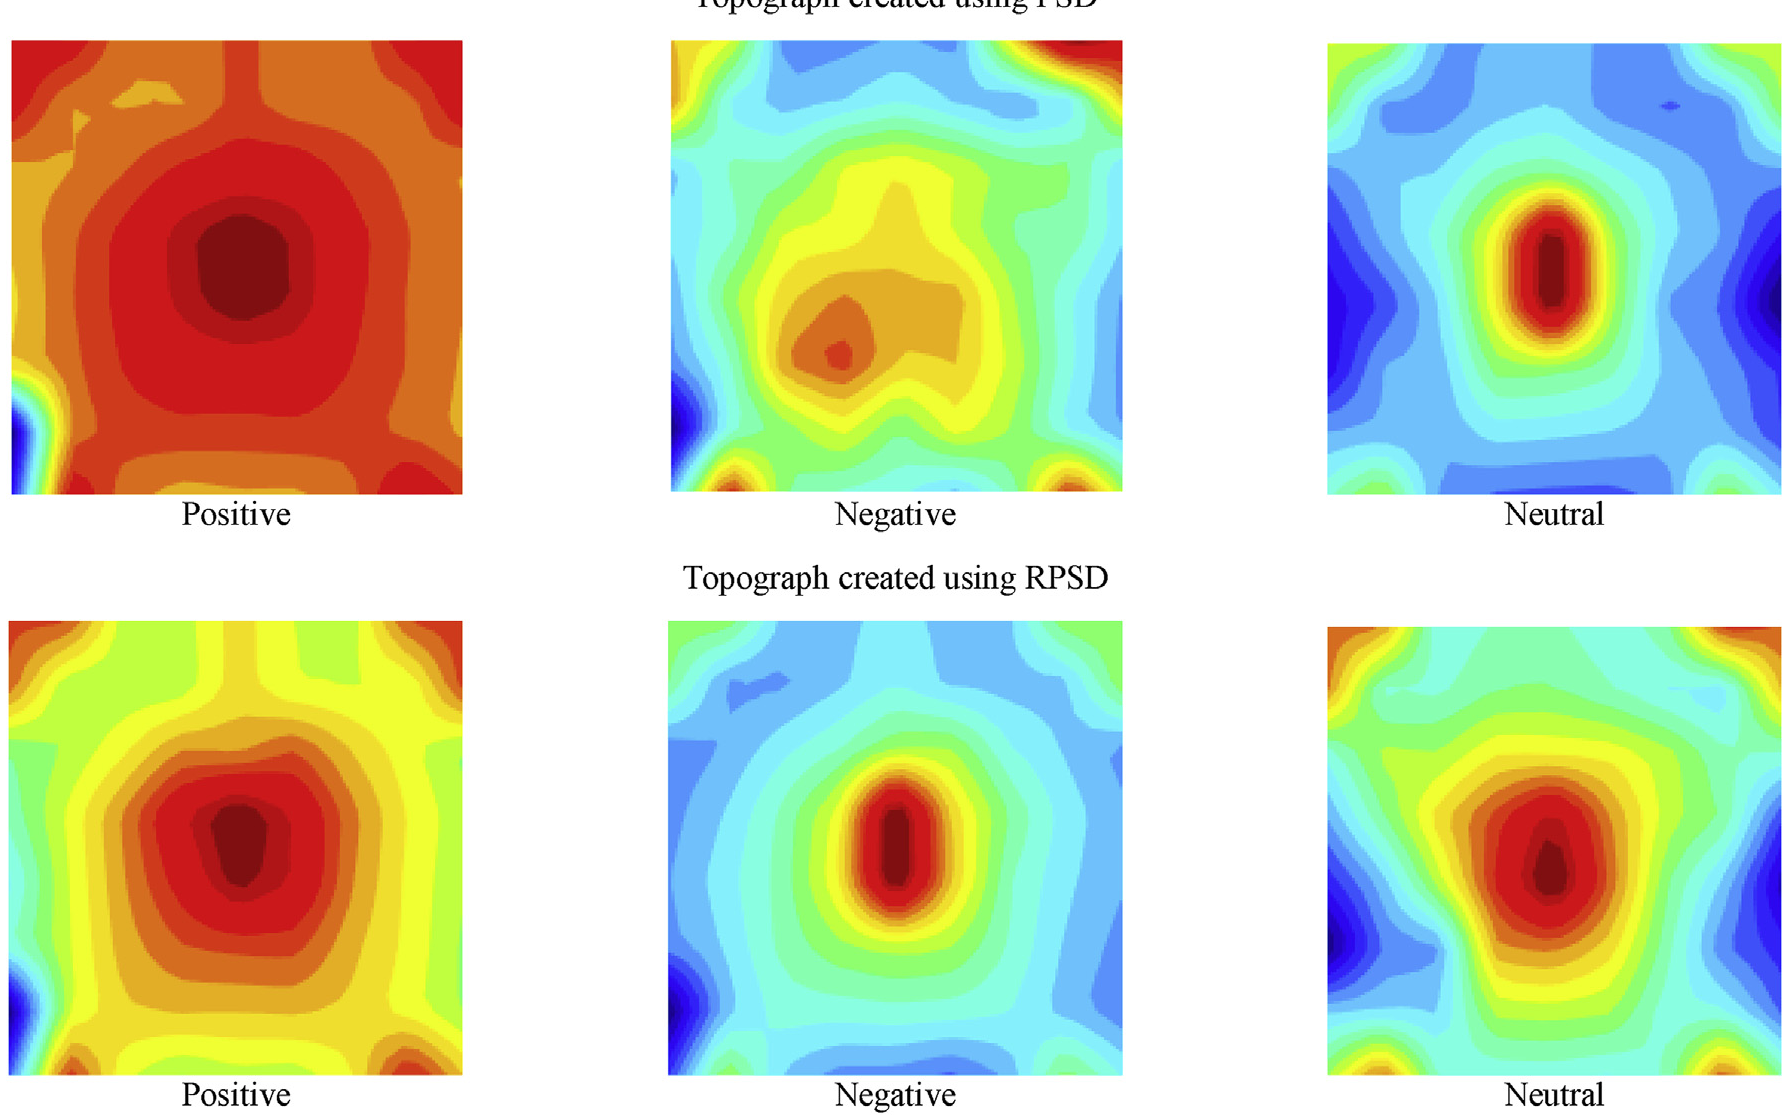 Figure 2: Visual evidence showing RPSD provides much sharper "feature signatures" than PSD.
Comparison with SOTA
| Method | Classifier | Accuracy |
|---|---|---|
| Differential Entropy | DBN | 86.08% |
| Group Sparse CCA | SVM | 86.65% |
| Proposed RPSD-Topograph | CNN | 94.63% |
Critical Analysis & Conclusion
The efficacy of this method lies in the Limbic System activation patterns captured in the topographs. The authors noted that the central part of the brain remained active across all emotions, allowing the CNN to learn a "baseline" while focusing on peripheral variations to distinguish specific emotions.
Limitations: While the spatial interpolation helps, the 9x8 grid is still relatively sparse. Furthermore, the 8-32 Hz band-pass filter excludes Delta and high-Gamma waves, which might contain additional nuanced emotional data.
Future Outlook: This approach turns a time-series problem into a computer vision problem. We can expect future iterations to use Video-based CNNs (3D-CNNs) or Transformers to capture how these brain "maps" evolve over time, potentially unlocking real-time emotional monitoring for medical and gaming applications.