
From Cells to Subscribers: Reimagining Network Performance through Trace Analysis
Implementation of End User Radio Key Performance Indicators Using Signaling Trace Data Analysis for Cellular Networks
The paper introduces a novel framework for implementing End-User Radio Key Performance Indicators (KPIs) and a Customer Experience Index (CEI) using 3GPP signaling trace data. By decoding RRC, S1AP, and X2AP protocols from real LTE network traces using Python, the authors transition performance measurement from aggregate network-level statistics to individual subscriber-level insights.
TL;DR
Modern mobile operators are facing a saturation point where market penetration exceeds 100%. In this "zero-sum" environment, preventing customer churn is more critical than acquiring new users. This paper proposes a transition from Network-centric KPIs to User-centric CEI (Customer Experience Index). By analyzing raw signaling traces (RRC, S1AP), the authors can pinpoint exactly which subscribers are experiencing "silent" failures that traditional cell-level metrics overlook.
The "Average" Trap: Why Your Network Looks Good but Customers Leave
The central motivation of this study is a classic statistical paradox: the Flaw of Averages. A cell might report a 99% ERAB (Radio Access Bearer) success rate, leading engineers to believe the network is healthy. However, that remaining 1% of failure might be concentrated on a few high-value enterprise customers or a specific neighborhood.
Existing monitoring tools often aggregate data at the eNodeB or Cell level, effectively "hiding" individual suffering. The authors argue that to truly manage Customer Complaint Behavior (CCB), we must observe the network through the eyes of the User Equipment (UE).
Methodology: The Anatomy of a Signaling Trace
To bridge this gap, the researchers implemented a high-performance ETL pipeline that transforms raw binary data into actionable intelligence.
1. Data Capture and Decoding
The system captures traces from 19 eNodeBs, involving three critical protocols:
- RRC (Radio Resource Control): Manages the "air" interface between the phone and the tower (Uu interface).
- S1AP (S1 Application Part): Handles the communication between the tower and the Core Network (MME).
- X2AP (X2 Application Part): Manages handovers between neighboring towers.
Using Python and the pycrate library, they decoded ASN.1 UPER/APER encoded packets to extract Information Elements (IEs) like RSRP (signal strength), RSRQ (signal quality), and specific release causes.
2. Architecture of the Measurement System

The proposed Customer Experience Index (CEI) for ERAB Accessibility is calculated by averaging the individual accessibility scores of every user in a cell, rather than taking the total successes divided by total attempts at the cell level.
Experimental Results: The Statistical Reality Check
The researchers compared the standard Network ERAB Accessibility against their proposed User CEI.
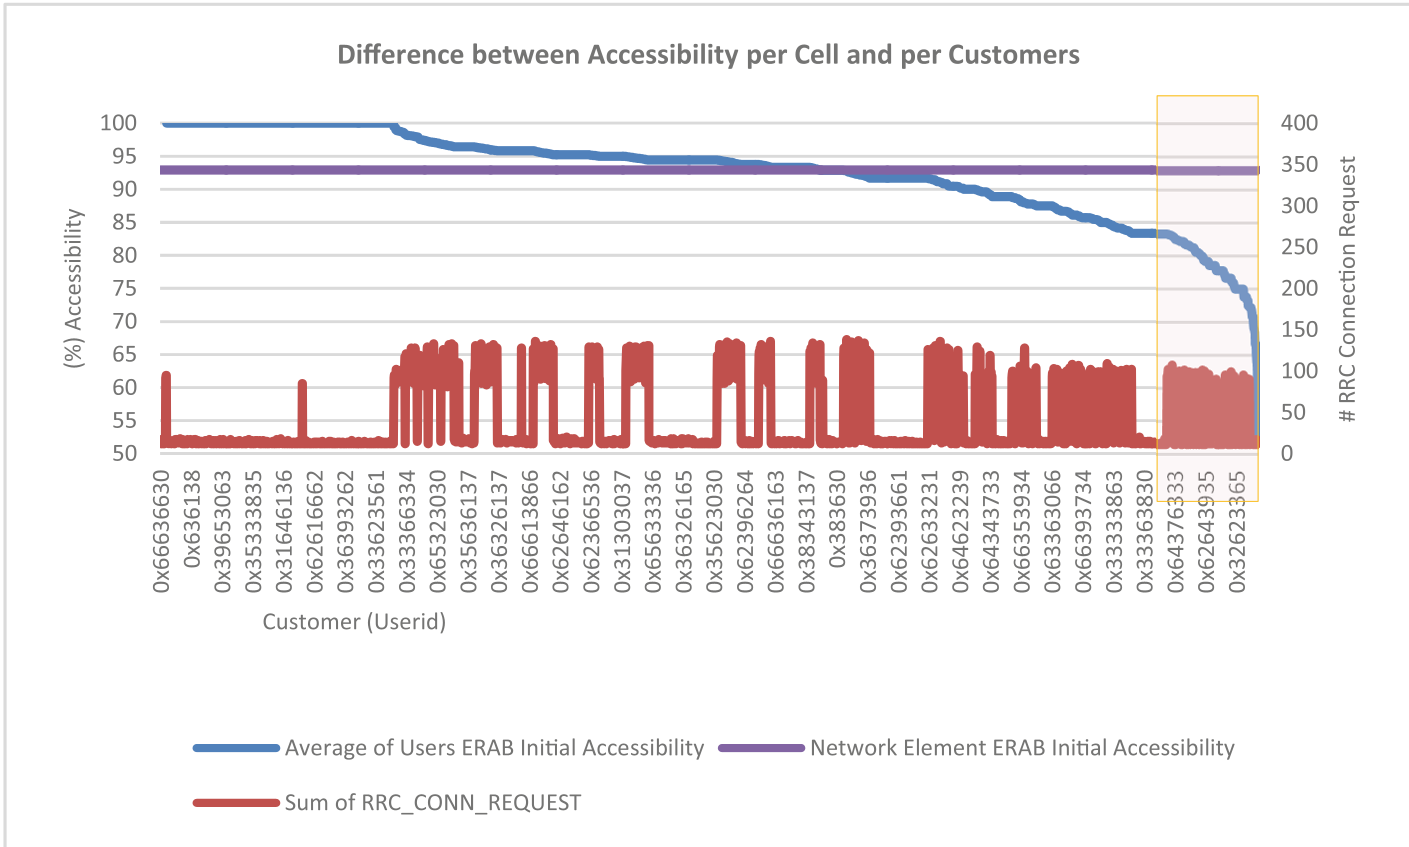 Figure: The disparity between Network-level KPIs (top line) and individual user experiences (scattered dots).
Key Findings:
- The Disparity: Statistical T-testing (with a P-value of 0.0006) proved that network-level stats and user-level stats do NOT represent the same reality.
- Hidden Issues: In 14 out of 133 samples, the Customer Experience Index was significantly lower than the Network KPI, identifying a segment of users likely to churn despite "good" network reports.
- Root Cause Analysis: Using Linear Regression, the authors discovered that Initial S1 Context Setup (the handshake between the tower and the core) was the most significant factor impacting user connectivity, more so than simple radio signal strength (RSRP).
Scalability: Can it Handle 5,000 Cells?
A common critique of trace-based analysis is the massive data volume. The paper provides a pragmatic hardware roadmap:
- Data Reduction: By filtering out PCCH (paging) messages—which account for the bulk of RRC traffic—the database size drops by over 50%.
- Hardware Efficiency: To scale to a network of 5,000 cells, the authors estimate a requirement of 165 CPU cores and 99GB of RAM—a manageable footprint for modern cloud-native telco data centers.
Critical Insight & Conclusion
This research moves the needle from Reactive network maintenance to Proactive customer care. By implementing vendor-independent, trace-based KPIs, operators can identify problematic zones where the "disparity of performance" is high.
Takeaway for the Industry: If you are only looking at Cell KPIs, you are flying blind to the 10% of users who are currently looking for a new provider. The future of 5G and Industry 4.0 (where the "user" might be a mission-critical robot) demands the per-UE granularity demonstrated in this study.
Limitations
While the study excels at signaling analysis, it notes that IP Throughput and Latency are harder to extract from traces due to encryption and complex timing requirements. Future work integrating User Plane (UP) data would complete the 360-degree view of the customer.