
Unveiling the Invisible City: Synthesizing 1-Billion-Edge Social Networks from Agent-Based Simulations
Endogenous Social Networks from Large-Scale Agent-Based Models
The paper presents a parallel computational framework for synthesizing and analyzing endogenous social networks from large-scale Agent-Based Models (ABM). Using the chiSIM model, the authors simulate 2.9 million individual agents in Chicago, generating a massive collocation network with over 1 billion edges to study emergent urban social structures.
TL;DR
Researchers from Argonne National Laboratory have developed a high-performance parallel framework to extract endogenous social networks from city-scale simulations. By simulating the daily lives of 2.9 million Chicagoans, they generated a "collocation network" with over 830 million connections, revealing that real-world social structures are far more demographically complex than the mathematical "Scale-Free" models often used in textbooks.
Background: Beyond Aggregate Statistics
In computational epidemiology and urban planning, we often rely on aggregate numbers—how many people got sick, or how many cars are on a highway. However, these metrics ignore the topology of interaction. Who exactly met whom? For how long?
The Chicago Social Interaction Model (chiSIM) aims to solve this by simulating every individual as an autonomous agent. But this creates a "big data" nightmare: a one-year simulation can generate terabytes of logs. The challenge is: how do you turn these messy logs into a coherent social graph without crashing a supercomputer?
Methodology: The Parallel Synthesis Pipeline
The authors' insight was to move away from serial processing and treat network generation as a distributed linear algebra problem.
1. Event-Based Logging
Instead of recording an agent's location every second, the system only logs state changes (e.g., when a person moves from "Home" to "Work"). This uses 4-byte unsigned integers to store IDs, keeping the log manageable (around 100-200 GB for a full year).
2. Matrix Decomposition and Parallelism
The transformation from logs to a network follows a rigorous mathematical path:
- Collocation Matrix (): A sparse matrix where rows are people and columns are time steps at a specific location.
- Adjacency Matrix (): Calculated via . The value at represents the total time person and spent together.
- Load Balancing: This is the "secret sauce." Since some locations (like O'Hare Airport) have thousands of people and others (a house) have two, the workload is partitioned based on the number of non-zero elements to prevent worker idle time.
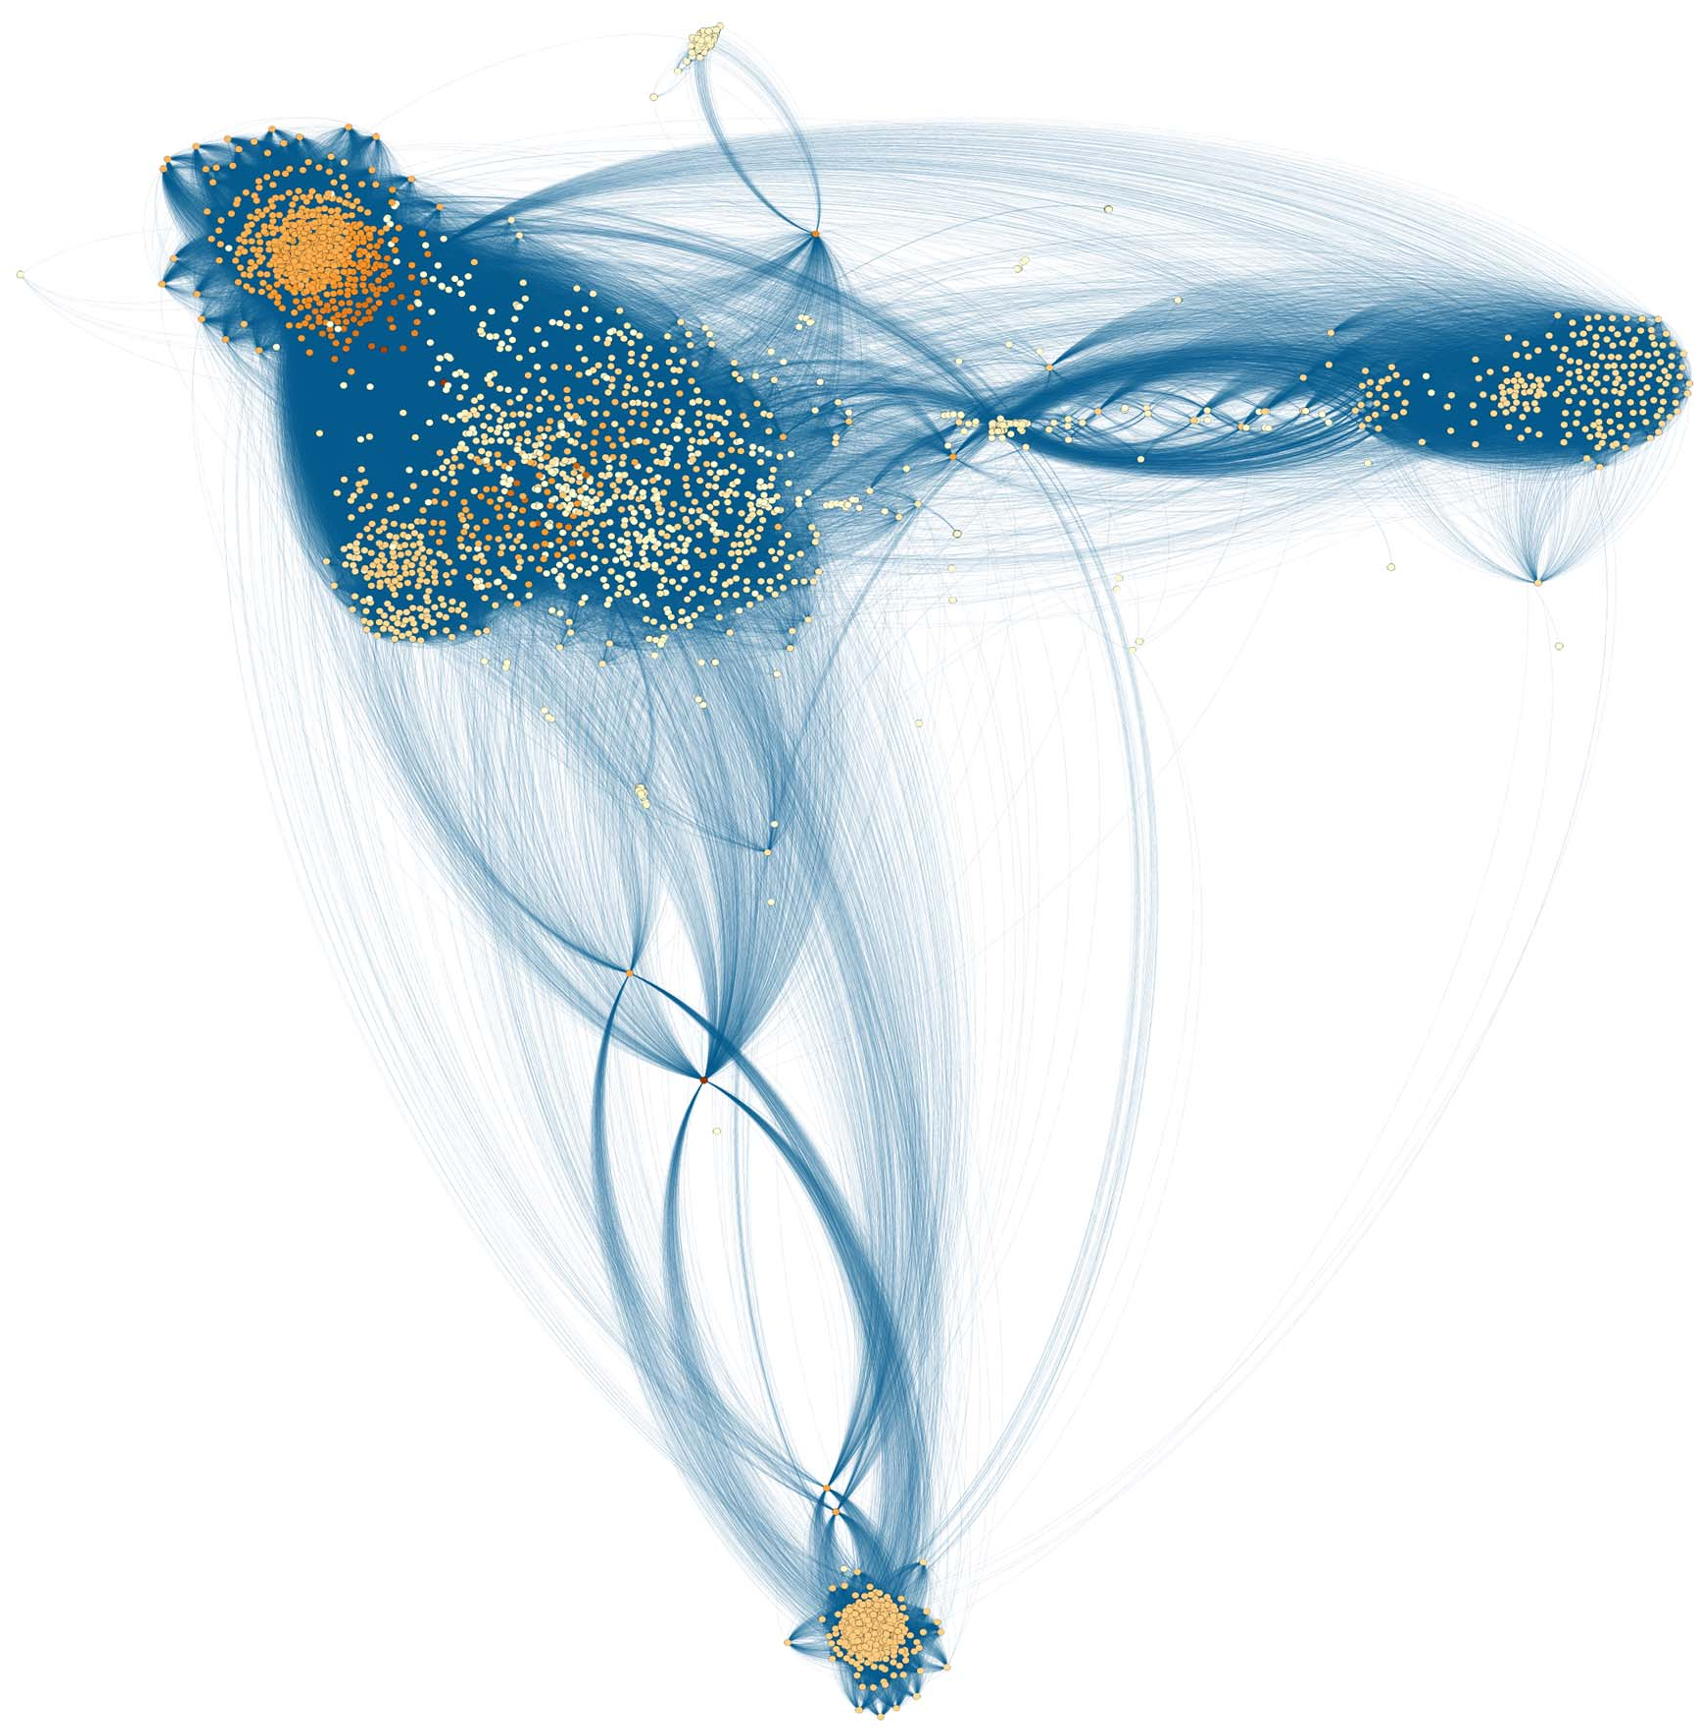 Figure 1: Visualization of local network clusters extracted from the global graph.
Experimental Results: Challenging the "Scale-Free" Myth
The synthesis of the 4th-week simulation data for Chicago (2.9M nodes, 830M edges) provided startling insights into urban connectivity.
The Vertex Degree Distribution
Most theoretical models assume a "Scale-Free" (Power-Law) distribution. However, when the authors plotted the real simulated data (Figure 3), it didn't fit. The network showed a truncated power law with unique "bumps" caused by physical constraints—you can't fit infinitely many people in one classroom or office.
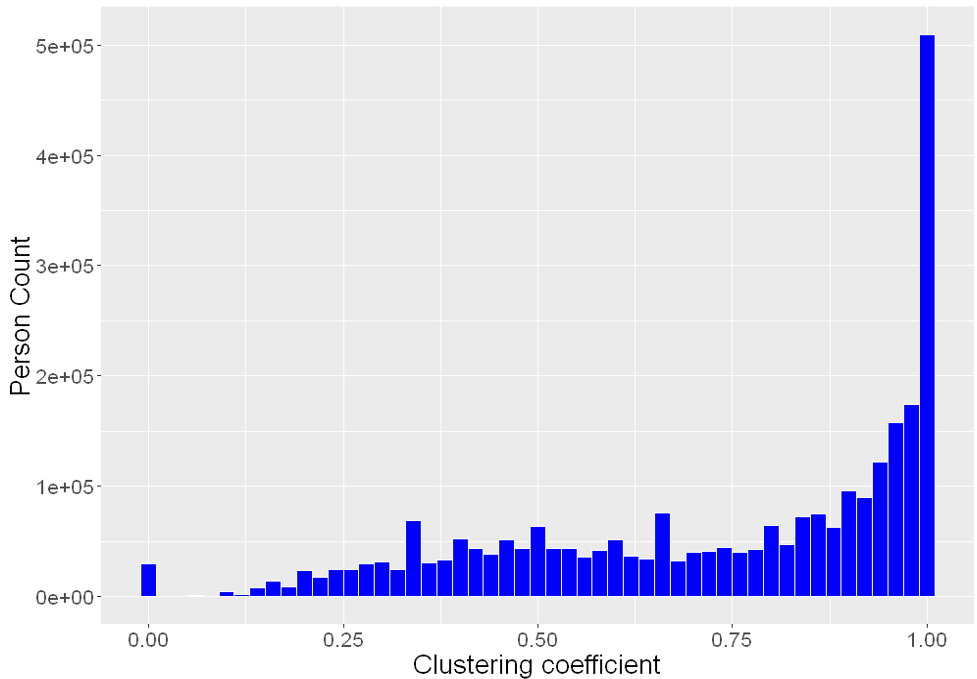 Figure 2: Log-log plot showing the deviation of simulated social data from theoretical power-law (red) and exponential (black) models.
Demographic Disaggregation
The most profound finding came from splitting the network by age.
- Children (0-14): Their degree distribution is nearly flat. Unlike adults who have a wide variety of social circles, kids are capped by school and class sizes, creating a highly specific interaction "signature."
- Seniors (65+): Showed outliers likely corresponding to high-density collocation in retirement communities or hospitals.
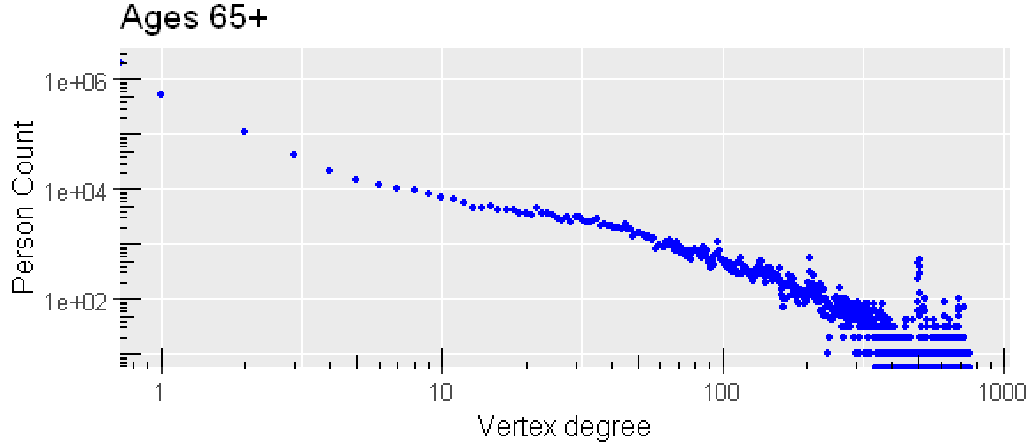 Figure 3: Distinct social signatures for different age groups in Chicago.
Critical Insight: Why This Matters
The value of this paper isn't just in the "speed" of the R/MPI implementation. It's in the demonstration of emergence. The authors didn't hard-code these social networks; they provided the "rules" of daily life (schedules), and the network emerged from those rules.
Takeaway: If you are building a model for the next pandemic, using a generic "Scale-Free" network might lead to incorrect predictions. You need a network that respects the spatial and demographic constraints of the city.
Limitations & Future Work
- Memory Footprint: Even with sparse matrices, the final graph required 10GB of RAM just to store in R. Further scaling will require even more aggressive sparse-matrix optimizations.
- Temporal Dynamics: Currently, the network is an "aggregate" of a week. Future research could explore how these Billion-edge graphs evolve hour-by-hour (Temporal Graphs).
Editor's Note: This work proves that with the right parallel architecture, R—often criticized for memory inefficiency—can indeed handle "Extreme Scale" network science.