
Mining the Pulse of Green Buildings: Energy Mode Analysis via R-Type Clustering
Research on energy consumption mode of green culture complex based on data mining technology
This paper presents a data mining framework for analyzing energy consumption patterns in a "Green Culture Complex" library. It utilizes monotone sequential logic detection for cleaning and R-type clustering to identify five distinct operational modes of lighting and outlet energy usage.
TL;DR
Managing "Green Buildings" requires more than just efficient hardware; it requires understanding how the building "breathes" energy. This paper introduces a data mining workflow that cleans noisy sensor data and uses R-type clustering to uncover 5 hidden operational modes in a large-scale culture complex, providing a blueprint for intelligent energy management.
Problem: The "Big Data" Blind Spot in Architecture
Modern green buildings are equipped with thousands of sensors, yet most of this data sits idle. The industry faces two hurdles:
- The Professional Gap: Standard data mining tools are too mathematically complex for most building managers.
- Contextual Void: Algorithms can find patterns, but they don't understand why a spike occurs—is it a faulty sensor or a scheduled cleaning shift?
Methodology: From Raw Data to Pattern Recognition
1. Hardened Data Cleaning
Energy meters are inherently monotone (they only count upwards). The authors utilize this physical constraint to detect anomalies. If a reading drops (), it's flagged.
- Outlier Detection: Uses monotone sequence logic to filter random noise.
- Data Recovery: Employs mean interpolation to fill gaps, ensuring the dataset is robust for clustering.
2. R-Type Clustering (Variable Clustering)
Unlike standard K-means which clusters points, R-type clustering focuses on the similarity between variables (daily load shapes). The similarity is measured by the correlation coefficient matrix .

Experiments & Results: Decoding the Library's Energy DNA
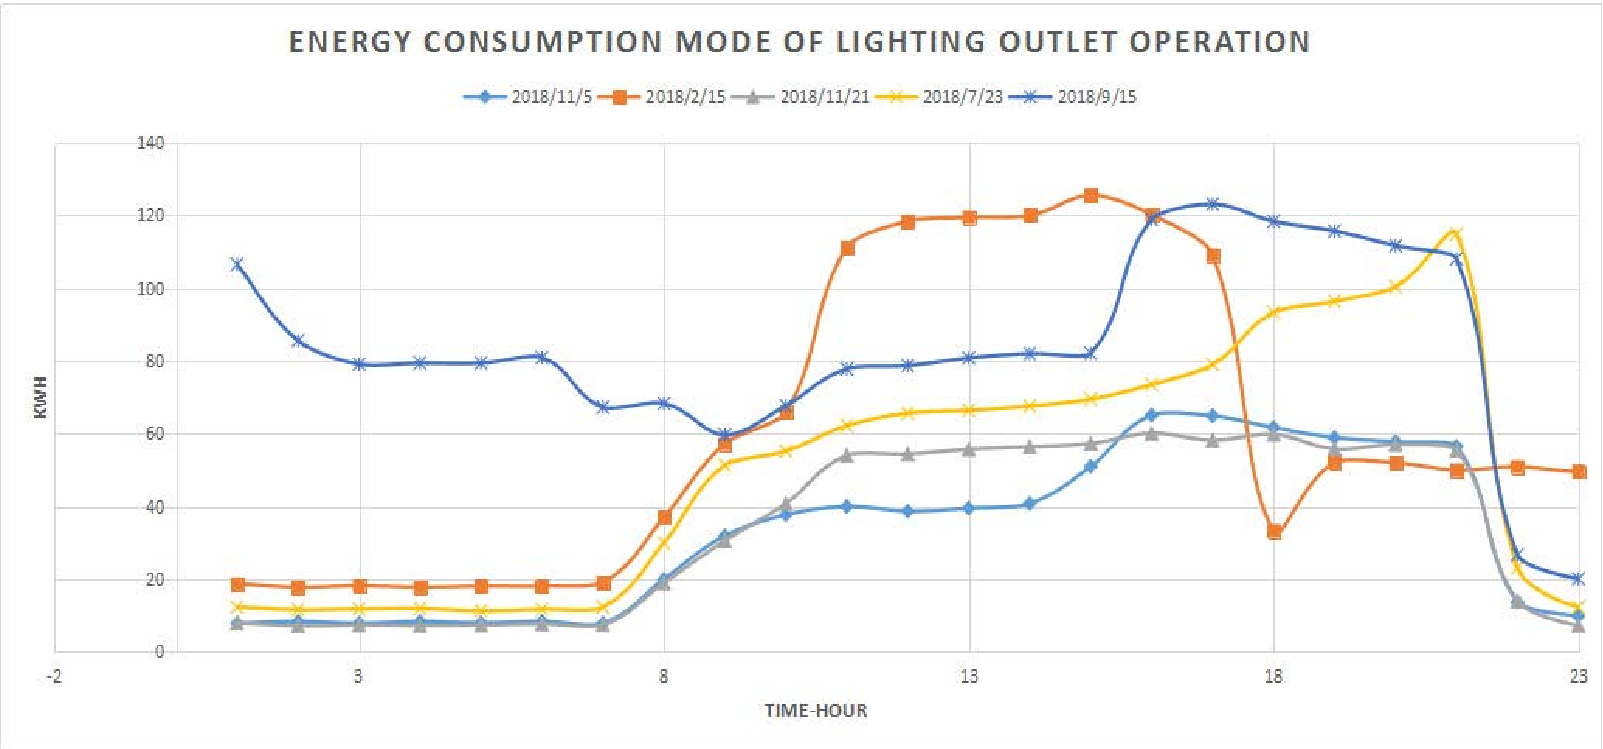
The study analyzed 426 days of energy consumption at a Library within a Culture Complex. By processing 10,224 data points, the algorithm successfully distilled the building's life into 5 primary modes:
- Mode 1: High consumption in the afternoon due to weak natural light.
- Mode 4: Low morning consumption (specifically Monday mornings when the library is closed for cleaning).
- Mode 5: An anomaly mode (one specific day) where lights stayed on until 9 PM, identifying an operational failure.
Key Performance Evidence:
- Agreement: The mined patterns matched field operation logs perfectly.
- Diagnostic Power: Successfully identified "Lighting waste" at noon in specific modes caused by rigid timer-based triggers rather than occupancy-based demand.
Critical Analysis & Conclusion
The true value of this work is not just the clustering, but the Professional Interpretation. By mapping "Mode 4" to "Monday Cleaning," the authors bridge the gap between abstract math and facility management.
Limitations: The reliance on mean interpolation can sometimes distort the variance of the data if the gaps are too large. Future work should explore more advanced generative models (like GANs) for data imputation.
Looking Ahead: This methodology paves the way for "Self-Diagnostic" buildings. Imagine a system that recognizes it has entered "Mode 5" (abnormal high use) and automatically alerts the manager to turn off the lights—truly realizing the promise of green, intelligent architecture.