
Social Network of Sensors: How Mobility Patterns Dictate the Pulse of Urban Sensing
Evaluating the Performance of Social Networks of Sensors under Different Mobility Models
This paper quantitatively evaluates the performance of a Social Network of Sensors (SNoS) by comparing three prominent mobility models: Lévy Flight, Continuous-Time Random Walk (CTRW), and the Song et al. preferential return model. It identifies how mobility patterns influence data detection and delivery times in hybrid environments containing both static and mobile nodes.
TL;DR
Is human mobility a blessing or a curse for smart city sensor networks? This paper evaluates the performance of "Social Networks of Sensors" (SNoS) under three mobility models: Lévy Flight, CTRW, and Song's preferential return model. The findings reveal a critical paradox: while human mobility is "free" (as we carry phones everywhere), our tendency to pause and return to base significantly degrades network latency compared to idealized random walks.
Background: The Rise of SNoS
As sensors are integrated into "Things"—cars, smartphones, and even wearable devices for animals—we are witnessing the birth of Social Networks of Sensors (SNoS). Unlike traditional Static Wireless Sensor Networks (WSNs), SNoS leverages the natural movement of carriers. The central question is: Which movement pattern yields the fastest data detection and reporting?
Problem & Motivation
Most prior work treats mobility as a means to reach a static optimal configuration. However, in a real city, mobility is dynamic and stochastic. The authors argue that we need to understand the physics of these movements (the "Why") to design efficient infrastructures. The main challenge is that human movement isn't truly random; it is governed by exploration (the urge to visit new places) and preferential return (the habit of going home).
Methodology: Simulating the Urban Pulse
The researchers used a city-wide simulation (100 ) with two types of nodes:
- Static Sensors: Placed in a regular lattice (e.g., on streetlights).
- Mobile Sensors: Distributed following an exponential population density model, moving at constant speeds.
They measured two key metrics:
- Detection Time (): Time taken for any mobile sensor to encounter an event.
- Report Time (): Time taken to relay that information to a central Sink (e.g., a police station).
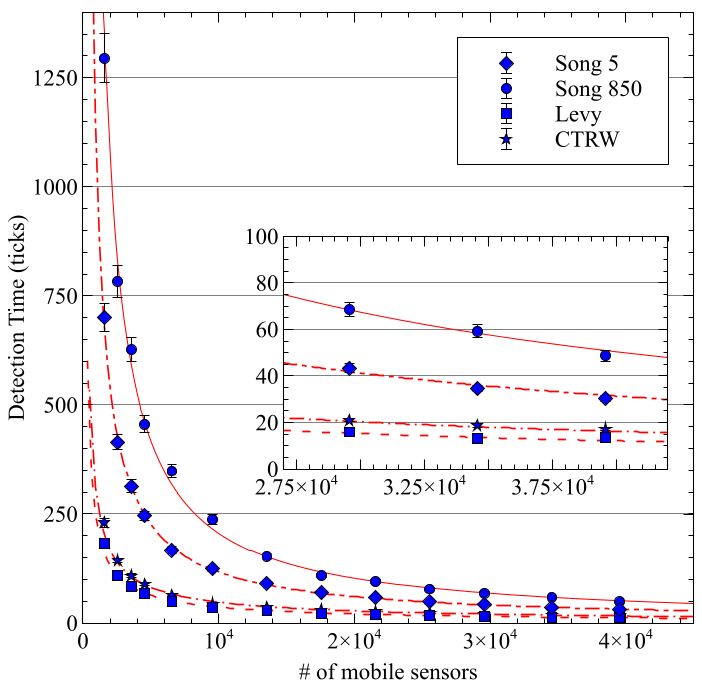 Fig 1: Detection Time follows a power law, showing a sharp decrease as sensor density increases.
Key Insights from Experiments
1. The Density Equalizer
One of the most profound findings is that in high-density environments, the mobility model matters less. When the city is crowded with sensors, the inter-contact frequency is so high that the specific "path" a sensor takes (be it a Lévy flight or a human commute) becomes secondary to the sheer volume of potential relay points.
2. The Human Bottleneck
Human mobility (Song's model) performed the worst. Why?
- Wait-time Cutoff: Humans stay in one place (work/home) for long periods.
- Preferential Return: We keep visiting the same nodes, leaving "blind spots" in the network coverage that only a few "explorers" reach.
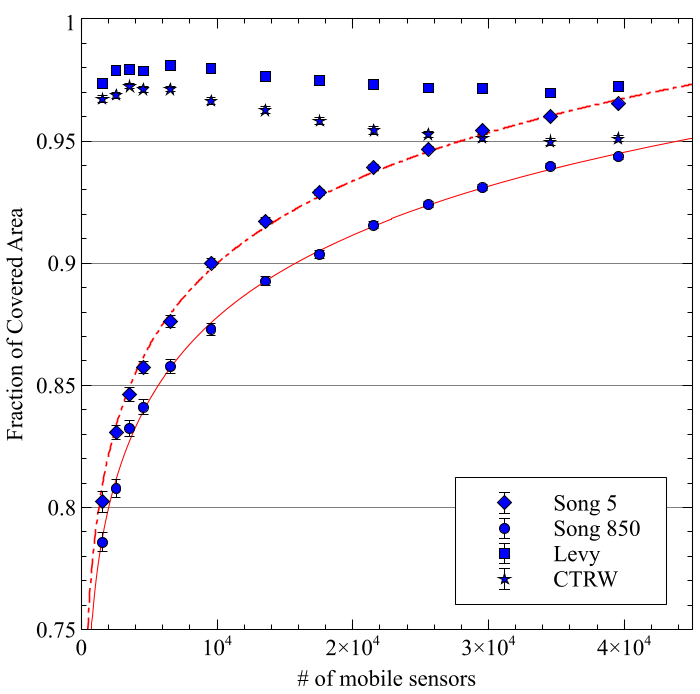 Fig 3: Coverage in human-centric models follows a logarithmic growth, suggesting a point of diminishing returns for adding more sensors.
3. The Gompertz Growth of Delivery
The delivery ratio (the probability of reporting an event within a time limit) follows a Gompertz function. This means there is a "lag phase" at low densities where the network barely functions, followed by a sudden "percolation" where performance sky-rockets, eventually saturating as we approach 100% delivery.
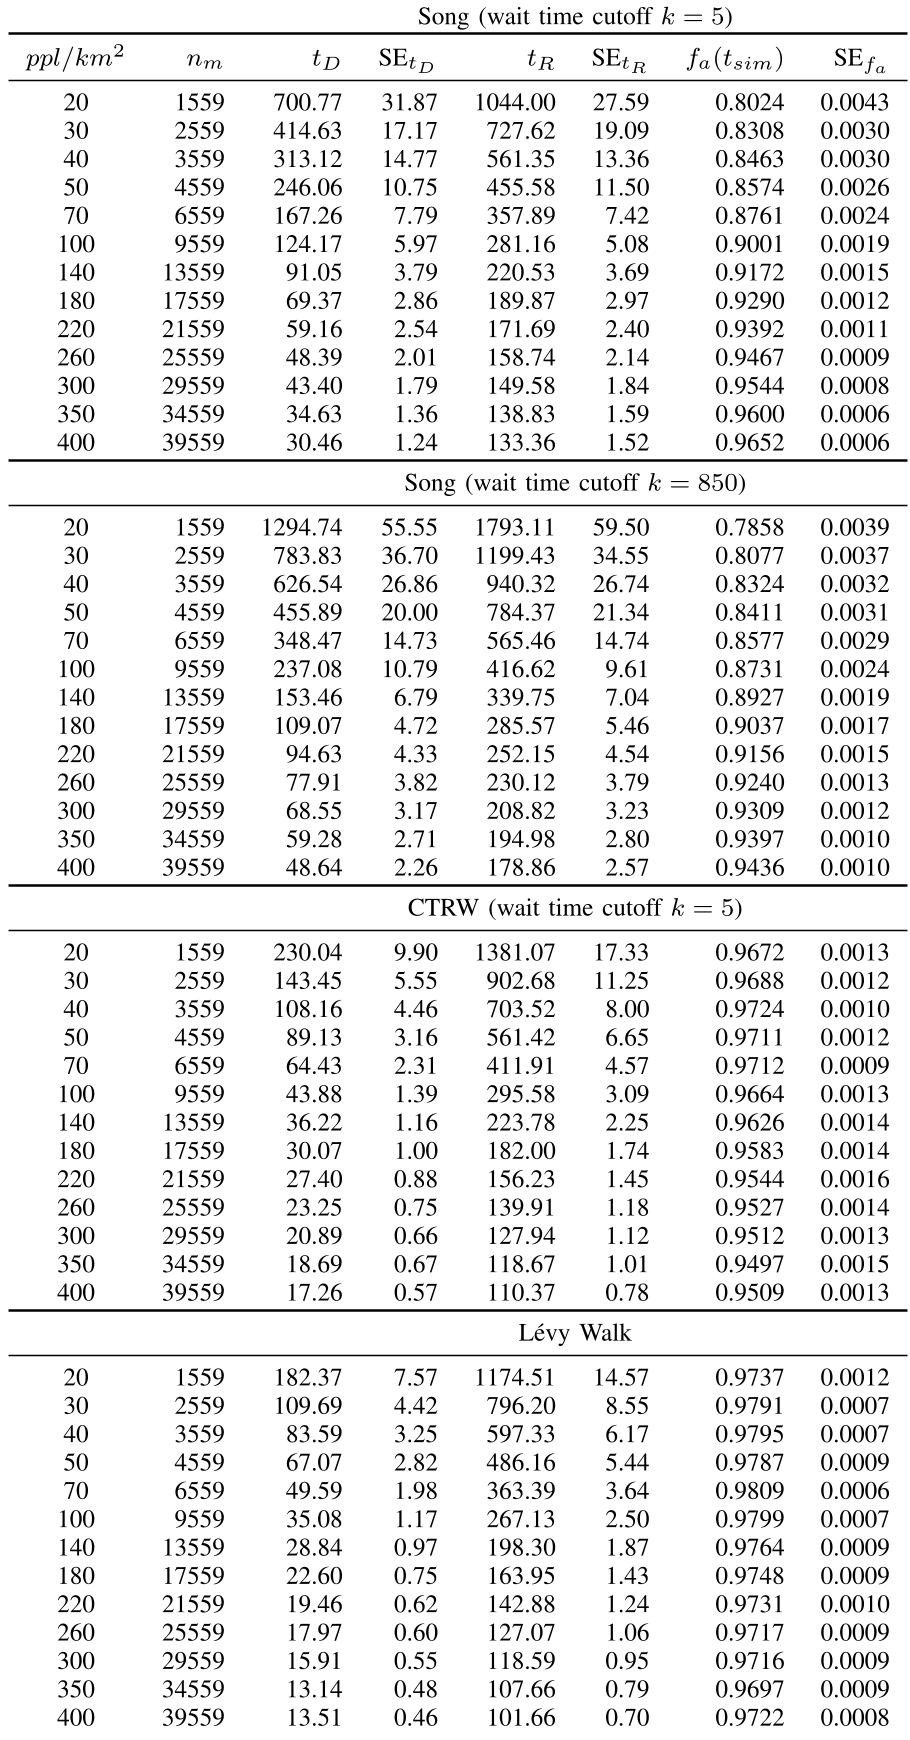 Table I: Detailed comparison showing how Lévy Walk consistently outperforms Song's model in both detection and report times.
Critical Analysis & Conclusion
This paper provides a sobering reality check for smart city designers:
- Radius over Density: Instead of trying to get 100% of the population to carry sensors, we should focus on increasing the sensor radius. Moving from Bluetooth to Wi-Fi can provide an order-of-magnitude improvement in connectivity with fewer nodes.
- Static Gateways are Key: Since mobile sensors (carried by humans) have high latency due to pauses, we need a backbone of static "gateways" that can take the data and move it at the "speed of light" via traditional networks.
Takeaway: In the design of SNoS, we must account for the "social" nature of our carriers. Humans are not random particles; our habits create temporal bottlenecks that only technological upgrades (like better range) can overcome.