
Beyond the Follower Count: Decoding True Digital Influence on Twitter
Evaluation of Influential Properties in Twitter
The paper introduces a comprehensive "Influence Metric" for Twitter accounts, integrating user activity, social degree, and content quality. By employing an h-index adaptation for retweets and likes, the method provides a dynamic alternative to static follower counts, achieving ranking accuracy comparable to commercial services like Followerwonk.
TL;DR
Researchers at the University of Thessaly have developed a new Influence Metric that moves beyond the vanity metric of follower counts. By adapting the academic h-index to social media "Likes" and "Retweets" and balancing it with user activity rates, the team has created an algorithm that rivals commercial tools while providing a more granular look at how influence actually scales across a social network.
The "Million Follower Fallacy"
In the early days of Social Network Analysis (SNA), influence was often treated as a simple popularity contest: the more followers you had, the more influential you were. However, modern research—and common sense—suggests this is a flawed premise.
The authors identify two key pitfalls in current OSN (Online Social Network) assessment:
- Passive vs. Active Users: A user with 10,000 followers who follows 20,000 others is often a "passive consumer" rather than an authority.
- Engagement quality: Thousands of followers mean nothing if your content results in zero retweets or authentic engagement.
Methodology: The Anatomy of Influence
The core innovation of this paper is the Influence Metric (IM). Unlike static scores, IM is dynamic and multidimensional.
1. The Power of the h-index
The authors borrow the h-index from the world of academia. In science, an h-index of 20 means a researcher has 20 papers with at least 20 citations each. In this Twitter context:
- Retweet h-index: If your h-index is 10, at least 10 of your last 100 tweets have been retweeted at least 10 times.
- This filters out "one-hit wonders" (a single viral tweet) and identifies users who provide consistent value.
2. The Weighting Formula
The metric is calculated by looking at "Adjusted Tweets" (h-index amplified activity) normalized by time, then scaled by the Followers to Following (FtF) ratio.
 Fig 1: The Influence Metric components including Order of Magnitude (OOM) and logarithmic FtF scaling.
Experimental Results & Power Laws
To validate the model, the researchers tested it against 11,500 accounts and compared the results to Followerwonk’s Social Authority.
Correlation with Commercial Standards
The study found that their metric closely tracked with established industry standards, but with a crucial difference: Sensitivity. Their metric distributed scores more broadly (0-50) compared to the commercial tool (30-70), allowing for better differentiation between "regular" users and "micro-influencers."
The Universal Law of Social Media
The data confirmed that influence follows a Power Law distribution. Most users have very low influence, while a tiny "long tail" of accounts holds massive impact.
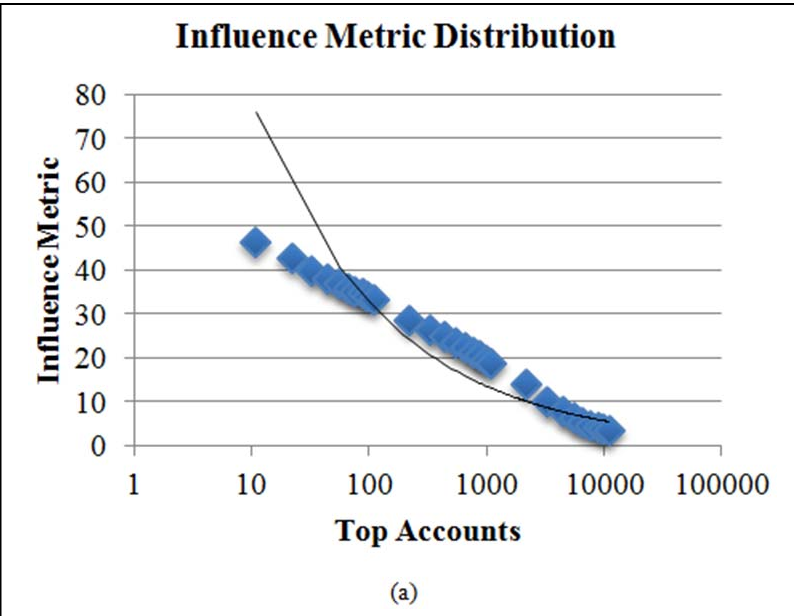 Fig 2: Comparison between Influence Metric (a) and Social Authority (b), showing the superior fit to the Power Law curve in the proposed model.
Critical Insights & Takeaways
The brilliance of this work lies in its Inductive Bias: it assumes that influence is an earned property of content quality rather than a static property of an account.
- Scalability: By using only the last 100 tweets and public API data, the metric is computationally efficient for real-time tracking.
- Anti-Gaming: Because it relies on the h-index (requiring multiple successful interactions), it is significantly harder for "bot farms" to spoof than simple follower counts.
Limitations: The study currently focuses on a "topic-agnostic" score. A user might be highly influential in "Machine Learning" but irrelevant in "Cooking." Future iterations would benefit from adding a semantic layer to categorize where that influence is most potent.
Conclusion
This research provides a robust, mathematically grounded framework for the "Influence Tracker" service. It proves that by combining academic metrics like the h-index with social network topology, we can move closer to a truth-based ranking of digital impact.