
Decoding Digital Footprints: How User Age Shapes Facebook Interaction Patterns
An Examination of the Behaviour of Young and Older Users of Facebook
This paper presents a Social Network Interaction Analysis (SNIA) focusing on age-based behavioral differences on Facebook. Using a dataset of 500 users, the authors quantify engagement through activity frequency metrics and visualize longitudinal interaction patterns to distinguish between young (15-30) and older (50+) cohorts.
TL;DR
This research investigates the behavioral rift between younger (15-30) and older (50+) Facebook users. By mining "Wall" interactions, the authors developed a frequency metric to quantify social engagement. The findings are stark: while younger users are prolific, high-frequency "repliers," over half of the older cohort remains largely inactive, suggesting that age is a primary determinant of digital social presence.
Contextual Positioning
In the landscape of Social Network Analysis (SNA), most research focuses on the topology of the graph—who is connected to whom. This paper shifts the lens toward Social Network Interaction Analysis (SNIA), prioritizing the tempo and volume of individual contributions. It acts as a foundational study for using digital data to monitor social well-being.
Motivation: Moving Beyond Structure to Behavior
The authors argue that the mere existence of a social connection does not equate to active engagement. The central problem is that we understand the "global footprint" of social media, but we lack clarity on how specific demographics—particularly the aging population—utilize these tools. The motivation is twofold:
- To quantify interaction through a standardized metric: Activity Frequency (af).
- To determine if age-based digital behaviors can eventually serve as indicators for epidemiological monitoring (e.g., identifying social withdrawal).
Methodology: Quantifying the Wall
The researchers extracted data from 500 public Facebook profiles. The core of their analysis revolves around the Activity Frequency formula:
Where is the total number of activities (comments/replies) and is the duration of the user's active history in days.
The Interaction Taxonomy
Users were categorized into five groups based on their frequency:
- G1: Zero activity (Silent users).
- G2 - G4: Increasing tiers of moderate activity.
- G5: High-frequency users (Activity every 20+ days).
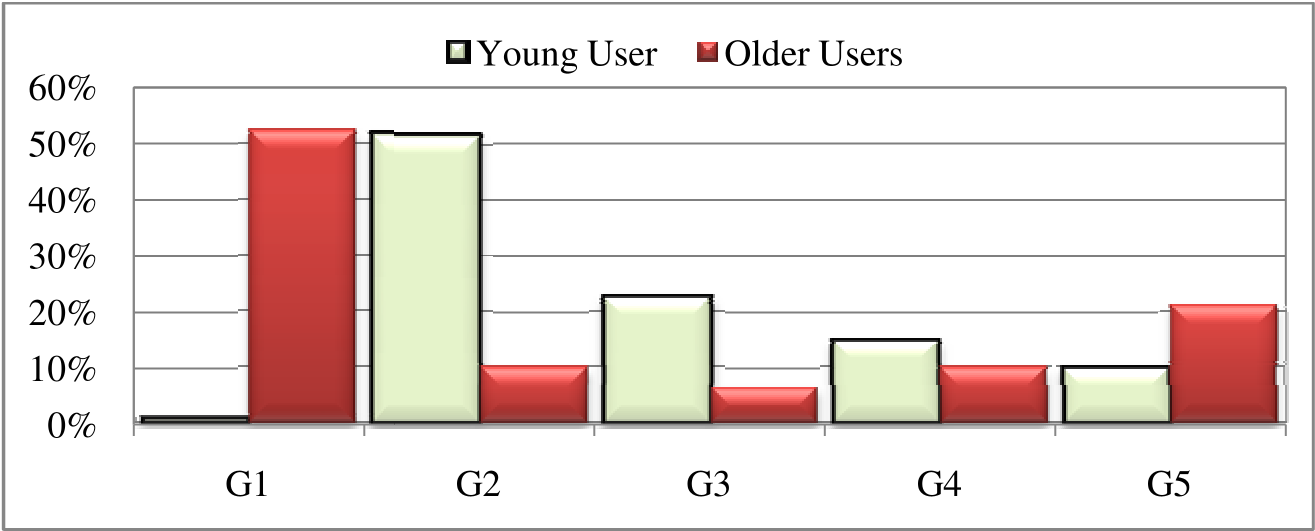 Fig 1 & 2: Comparison of Comment and Reply Frequencies between cohorts.
Experimental Insights: Younger Prolificacy vs. Older Silence
The disparity between the two age groups is significant:
- The Inactivity Gap: 52% of older users exhibited zero activity (G1) on their walls, compared to a mere 1% of younger users.
- The Engagement "Nucleus": Younger users are most representative in the G2 category (52%), showing a consistent "pulse" of interaction.
- Reply Dominance: Younger users are much more likely to engage in "Replies" (31% in G5), indicating a more reactive and conversational style of social media use.
Visualizing the "Rhythm" of a User
The paper provides a longitudinal visualization of a "representative" younger user over 370 days. By plotting activity over time, the authors identified three distinct phases:
- Band A: Early engagement (consistent but low volume).
- Band B: Concerted activity (a major spike/nucleus in mid-year).
- Band C: Current behavior patterns.
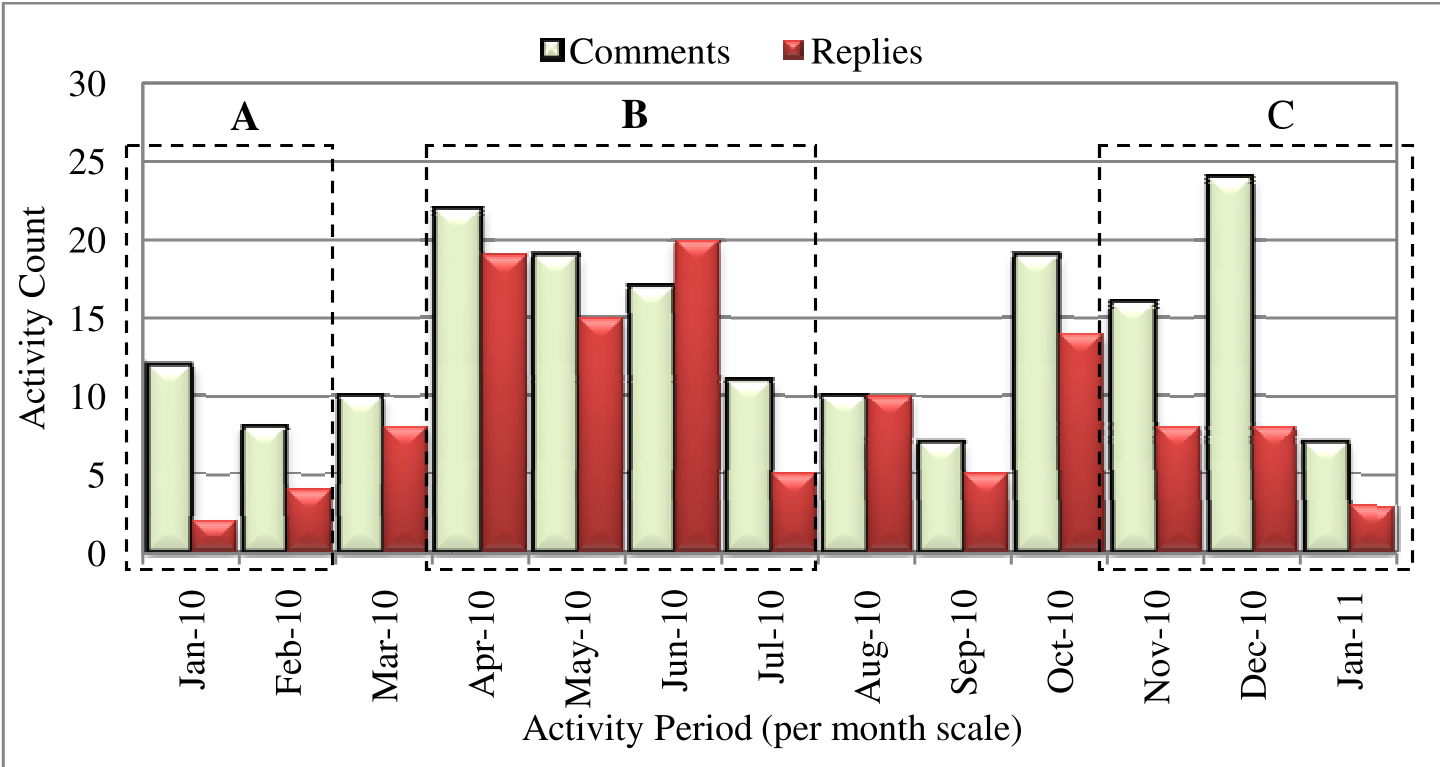 Fig 3: Longitudinal visualization of a user's digital activity, highlighting non-random engagement clusters.
Critical Analysis & Future Outlook
The study’s strength lies in its ability to transform raw timestamps and post counts into a narrative of social engagement. However, the reliance on public profiles is a notable limitation, as it may introduce a selection bias (users who set profiles to 'everyone' may be inherently more extroverted).
Takeaway for the Industry
The takeaway is profound for both social scientists and software developers: Digital interaction is non-random. These patterns—spikes, plateaus, and silences—offer a window into the user's real-world social health. Future iterations of this work could lead to "early warning systems" for social isolation in the elderly, where a sharp drop in af (Activity Frequency) triggers a community or medical check-in.
Key Takeaways Table
| Feature | Younger Users (15-30) | Older Users (50+) |
|---|---|---|
| Primary Activity Group | G2 (Consistent/Frequent) | G1 (Zero/Inactive) |
| Interaction Style | High volume of replies | Infrequent posting |
| Activity Nucleus | Clear clusters of high engagement | Scattered, lower density |
| Prediction Potential | High (for lifestyle changes) | Moderate (for social isolation) |