
Decoding the Social Pulse: An Empirical Journey Through User Growth and Behavior
An Exploratory Study of the Users' Behavior on Social Network Sites
This exploratory study utilizes Google Analytics to monitor and analyze user behavior across four diverse Web 2.0 Social Network Sites (SNS). By applying statistical techniques like Compound Daily Growth Rate (CDGR) and time-series analysis, it identifies distinct growth patterns and behavioral stabilization metrics (e.g., % New Visits at 50%) across different service models.
TL;DR
In the early era of Web 2.0, understanding why some social networks flourished while others faded was often a matter of intuition. This study brings empirical rigor to the table, using longitudinal Google Analytics data from four distinct companies to define what "stability" looks like: a 50% threshold for new visits and a nuanced understanding of Compound Daily Growth Rates (CDGR).
The "Why": Beyond the Hype of Web 2.0
The transition to Web 2.0 shifted the internet from a "read-only" medium to a "read-write" collaborative ecosystem. However, for site founders, the behavior of users—the very engine of these platforms—remained a "black box." The central problem addressed here is the lack of standardized archetypes for user growth. Is a sudden spike in traffic a sign of viral success or just a temporary anomaly? Does a declining rate of new visitors signal death, or is it a natural transition to a mature, member-driven community?
Methodology: The Analytics of Engagement
The study focuses on four cases with varying value propositions:
- Company A: Topic-based article aggregation.
- Company B: Campus-club interaction.
- Company C: Information-centric (Restaurant data).
- Company D: Geolocation-based blogging.
The author moves beyond simple "hit" counts, focusing on:
- Compound Daily Growth Rate (CDGR): A sophisticated look at daily growth compared to the platform's inception.
- Percent of New Visits (%NV): Measuring the balance between discovery (new users) and retention (returning users).
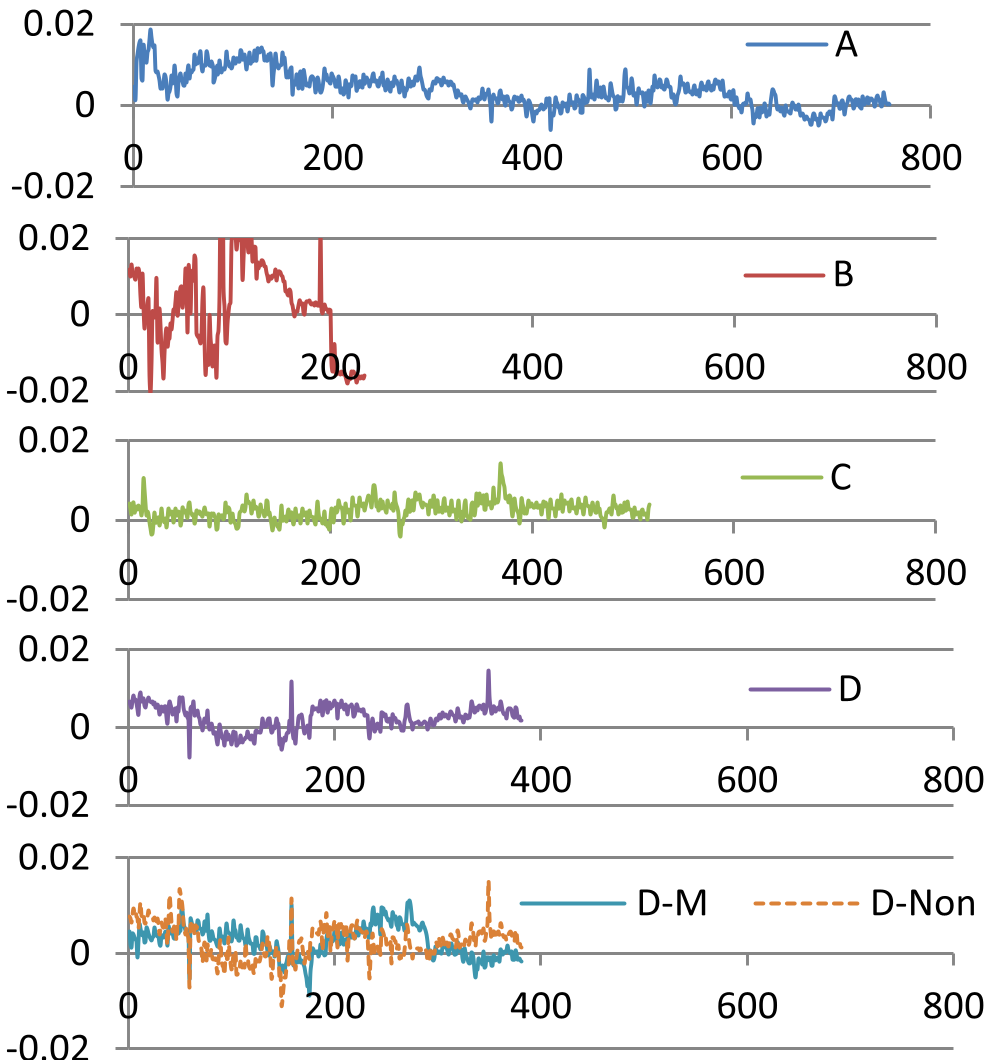
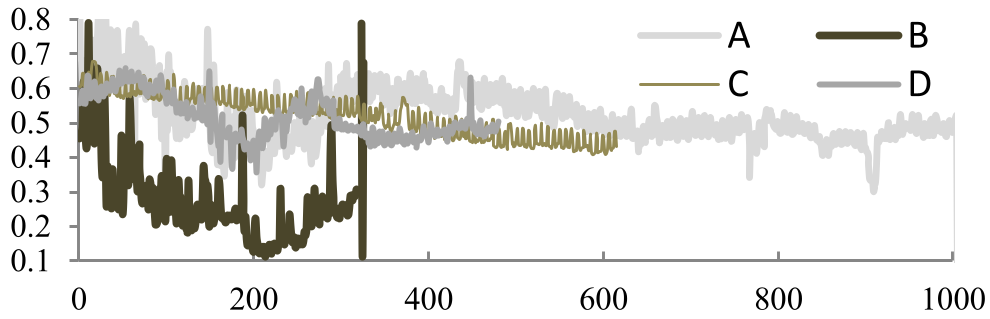 Figure 1: The CDGR curves reveal the "soul" of the sites—Company B’s volatility reflects promotional campaigns, while Company C shows the steady climb of a utility-based service.
Key Insights: What the Data Tells Us
1. The "Stability Benchmark"
One of the most profound findings is the stabilization of % New Visits (%NV) at roughly 50%. For most successful platforms (A, C, and D), after the initial "honeymoon phase" of high discovery, the ratio of new to returning users settles at a 1:1 balance. If a site (like Company B) falls significantly below this, it enters a "desperate position," struggling to replenish its user base as older users churn.
2. The Member/Non-Member Time Lag
In the analysis of Company D, the author discovered a curious 50-day gap between the growth curves of registered members and non-members. This suggests a "trickle-down" or "lead-lag" effect where one group’s behavior drives the other’s interest. Understanding whether "lurkers" (non-members) drive conversions or if hyper-active members attract the crowds is vital for community management.
 Graphic placeholder: Representing the various metrics (BR, %NV, ATOS) extracted via Google Analytics.
Critical Analysis & Conclusion
Takeaway
This research moves the needle from qualitative "growth hacking" to quantitative "growth science." The 50% %NV threshold remains a useful heuristic for community-led platforms even today.
Limitations & Future Work
The study acknowledges that while patterns emerged, the "why" behind specific time lags remains speculative. Furthermore, the modern era of "Infinite Scroll" and "Algorithm-driven Feeds" (like TikTok) might disrupt the traditional %NV stabilization patterns seen in the blog-oriented era of 2006-2009. Future research should look at how these metrics translate to the mobile-first, short-form video world.
Keywords: Google Analytics, User Behavior, SNS, Compound Daily Growth Rate, Web 2.0.