
Redgraph: Untangling the Semantic Web through Immersive 3-D Extrusion
Exploring Semantic Social Networks Using Virtual Reality
This paper introduces Redgraph, the first generic Virtual Reality (VR) visualization tool designed for Semantic Web data (RDF). It utilizes a novel "3-D extrusion" technique to allow users to interactively pull nodes from a 2-D layout into an immersive 3-D space, specifically targeting complex social networks such as patent innovation data.
TL;DR
Redgraph is a pioneering VR framework that tackles the "spaghetti graph" problem of Semantic Web data. By allowing users to manually "extrude" nodes from a 2-D plane into a 3-D immersive CAVE environment, it transforms complex social networks (like USPTO patent data) into navigable, kinesthetic experiences. The results show that while 2-D is fine for broad overviews, interactive 3-D is superior for picking apart dense, fine-grained relationships.
Background: The "Big Fat Graph" Problem
As the Semantic Web grows, researchers often default to the "Big Fat Graph" approach. However, RDF data is notoriously difficult to visualize in 2-D because real-world networks usually follow a power-law distribution—a few "hubs" create massive clusters that drown out metadata.
The authors argue that we shouldn't force users to choose between flat 2-D graphs and confusing, fully-automated 3-D "starfields." Instead, they propose a middle ground: Interactive Extrusion.
Methodology: User-Driven Dimensionality
Redgraph's core innovation isn't just "showing" data in 3-D, but letting the user create the third dimension.
- Vis3D Vocabulary: The authors created a bridge between GraphXML and RDF. This allows the visualization settings (nodes, colors, positions) to be stored as semantic triples right alongside the actual data.
- The Extrusion Process:
- The system starts with a standard 2-D layout (e.g., Kamada-Kawai).
- Using a VR wand, the user "touches" a node.
- By pulling the wand back, the user drags the node into the 3-D space, stretching the virtual "springs" (links) behind it.
- Kinesthetic Comprehension: Users can walk "into" the data, using head-tracking and stereoscopic vision to naturally resolve occlusions that would be impossible to navigate on a flat screen.
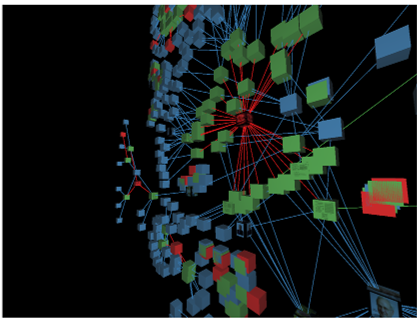 Figure 1: From left to right: Metadata display when touching a node; the initial 2-D layout; and the interactive 3-D extrusion in action.
Experiments: Solving the Patent Mystery
The researchers tested Redgraph on a dataset from the US Patent and Trademark Office (USPTO), focusing on computing history (Xerox PARC, etc.).
The User Study
21 subjects were tasked with answering questions about patent inventors and affiliations using both 2-D and 3-D methods.
- Fine-Grained Success: For tasks requiring users to "unpick" dense clusters (e.g., finding a specific inventor in a sea of patents), the 3-D extrusion was significantly faster.
- The 2-D Advantage: For simple, broad-structure questions, 3-D was sometimes a distraction. If the answer is visible at a glance, extruding nodes is just extra overhead.
- Qualitative Feedback: Every subject preferred the 3-D display for exploration, stating it felt like a "cognitive thought map" that offered "free space" for organization.
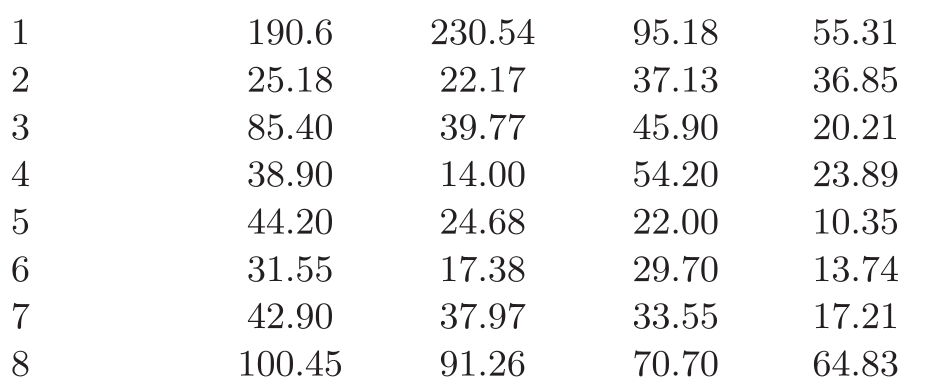 Table 1: Comparison of mean response times (in seconds). Note Question 5, where 3-D outperformed 2-D by 50%.
Scaling with Inference
One of the most powerful features discussed is the use of Semantic Inference. When the data becomes "overwhelming" (e.g., 47,000+ triples in biotech patents), Redgraph uses inference to collapse complex paths. Instead of showing Inventor -> Patent -> Company, it can infer and display a direct Inventor -> Company link, dynamically simplifying the visualization.
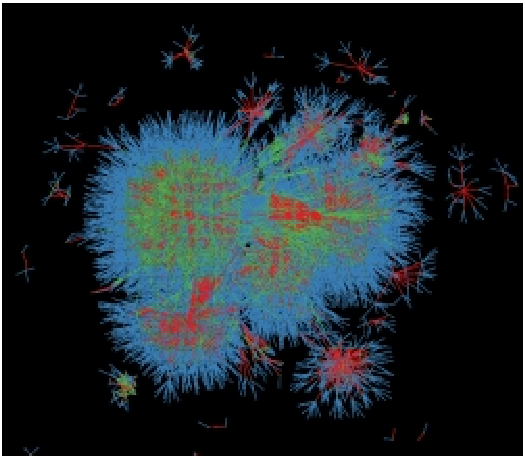 Figure 2: The biotech patent network before (left) and after (right) applying semantic inference to filter the view.
Critical Analysis & Conclusion
Redgraph proves that immersion is not a gimmick—it is a tool for information density management. By relying on human proprioception (the sense of where our body parts are in space), we can organize data more intuitively than any automated algorithm.
Limitations:
- The system requires specialized hardware (CAVE environments), which are rare compared to modern VR headsets like the Quest or Vision Pro.
- The "manual" nature of extrusion means the user must put in work to organize the graph; it is not a "one-click" solution.
Future Work: The authors suggest moving toward hyperbolic browsing (where nodes shrink as they move away from the user's focus) and bringing these tools to social virtual worlds. As we move toward a "Spatial Web," Redgraph’s marriage of semantic logic and 3-D interaction provides a vital blueprint.