
SocialViz: Moving Beyond Graphs to Visualize the Frequency of Social Interactions
Exploring Social Networks: A Frequent Pattern Visualization Approach
The paper introduces SocialViz, a visualization tool designed to map social networks through the lens of Frequent Pattern Mining. Unlike traditional graph-based visualizers, SocialViz explicitly displays the frequency of interactions among multiple entities using a structured 2D coordinate system and specialized line-merging techniques.
TL;DR
SocialViz is a novel visualization approach that moves away from traditional "spider-web" node-edge graphs. By borrowing techniques from market basket data mining, it visualizes social networks as frequent patterns on a 2D grid, making it easy to see exactly how often specific groups of people (not just pairs) collaborate.
Contextual Background
In an era of massive social data, simply knowing who knows whom isn't enough. We need to know how well they know each other. Most existing tools represent relationships as lines (edges) between dots (nodes). When looking at a research team or a criminal ring, these graphs quickly become a mess of overlapping lines that fail to show the difference between a one-time collaboration and a lifelong partnership.
The Problem: The "Triangle" Trap
The authors highlight a critical flaw in traditional graphs. If researchers A, B, and C form a triangle of edges, does that mean they all wrote a paper together? Or did they only write separate papers in pairs? Standard graphs can't tell the difference without becoming incredibly complex (using hypergraphs or bipartite structures).
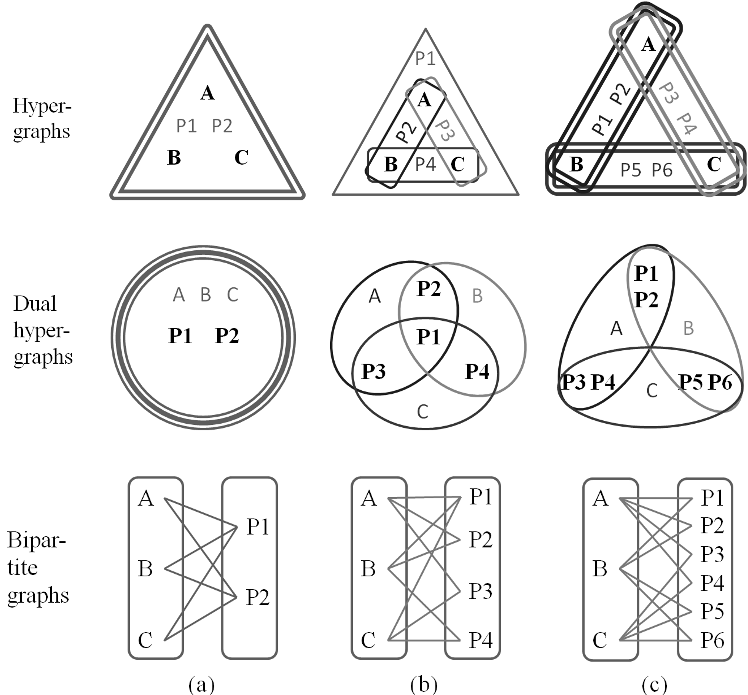 Figure 1: Hypergraphs and bipartite graphs often become cluttered and "unwieldy" when depicting multi-entity relationships.
Methodology: SocialViz and the Frequent Pattern Insight
The core insight of SocialViz is to treat social interactions like a "shopping basket." If Researchers A, B, and C co-author a paper, they represent a "transaction."
The Visual Language
- X-Axis: Social entities (Names/IDs).
- Y-Axis: Frequency (e.g., number of papers or phone calls).
- Horizontal Lines: A single interaction or a group collaboration.
- Icons:
- A Filled Diamond represents an individual's total activity.
- An Unfilled Diamond/Circle indicates participation in a group.
- A Filled Circle marks the "end" of a specific group pattern.
Reducing Clutter: Merge-and-Fork
To manage large networks, SocialViz uses three clever techniques:
- Canonical Ordering: Groups entities alphabetically or by frequency to make lookups intuitive.
- Branching (Merging): If two groups share the same prefix (e.g., [Han, Lakshmanan, Ng] and [Han, Lakshmanan, Tung]), the shared part of the line is merged, and it forks only where the members differ.
- Projection: Multiple lines with the same frequency can be collapsed into a single line with a
[+]expander button to save vertical space.
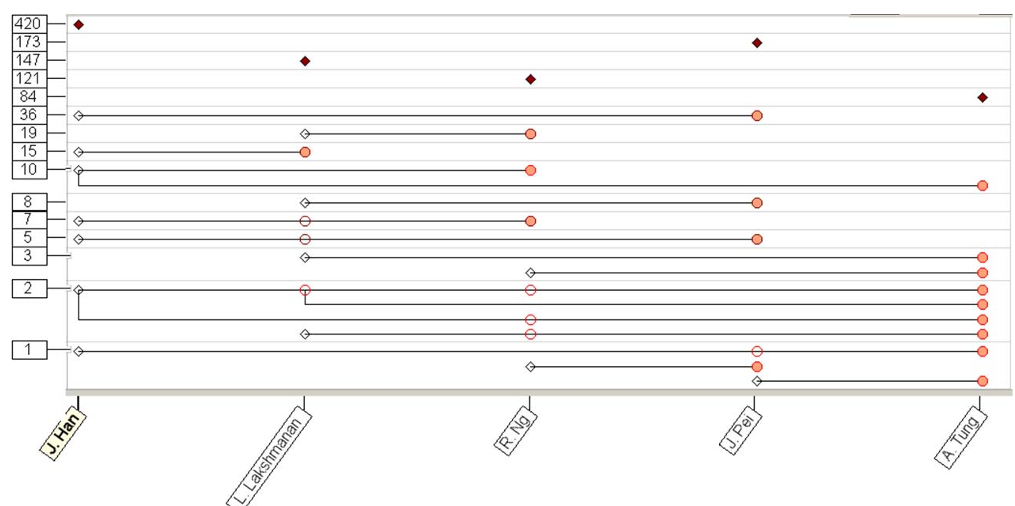 Figure 2: The SocialViz interface showing a coauthorship network. Common prefixes are merged to reduce icon count.
Experiments and Results
The authors tested the tool on two distinct datasets:
- Academic Coauthorship (DBLP): Users successfully identified that "Han" was the most prolific (420 papers) and accurately traced specific 3- and 4-person teams.
- Cellular Communication (VAST 2008): By looking at the frequency of calls, SocialViz helped investigators identify a "Brother" (highest call frequency) and a "Coordinator" (highest number of distinct contacts) within a suspect's call logs.
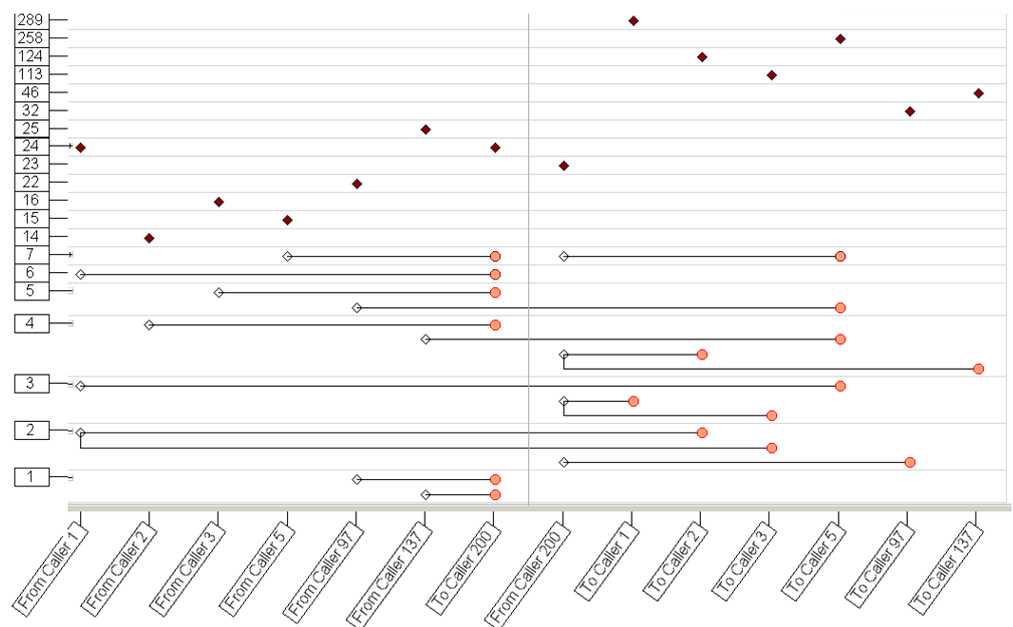 Figure 3: Analyzing Caller 200's network. The clear horizontal lines allow for instant frequency comparisons that node-edge graphs obscure.
Critical Insight & Conclusion
SocialViz represents a significant shift in Human-Machine Interaction for data mining. While node-edge graphs are great for "topology" (who is connected?), SocialViz is superior for "intensity" and "group dynamics."
Takeaway: If your task requires understanding the weight and co-occurrence of groups rather than just the network's skeleton, a frequent-pattern-based approach like SocialViz is far more effective.
Limitations: The current implementation still relies on 2D horizontal lines, which may still face vertical scaling issues as the number of unique frequent patterns grows into the thousands, requiring more advanced filtering or hierarchical clustering in future iterations.