
From Noise to Signatures: Decoding Visual Impairment Through Multifractal Pupil Dynamics
From Extraneous Noise to Categorizable Signatures: Using Multi-scale Analyses to Assess Implicit Interaction Needs of Older Adults with Visual Impairments
This study introduces a novel application of wavelet-based multifractal analysis to examine Pupillary Response Behavior (PRB) in older adults with Age-related Macular Degeneration (AMD). By extracting the Left Slope (LS) of the multifractal spectrum, the researchers successfully distinguished between healthy controls and AMD patients with varying levels of visual impairment, where traditional clinical measures failed.
TL;DR
This research moves beyond simple averaging of pupil diameter to reveal how the irregularity of pupillary response behavior (PRB) can serve as a metabolic signature for Age-related Macular Degeneration (AMD). By applying wavelet-based multifractal analysis, the authors identified a specific metric—the Left Slope (LS)—that can distinguish between healthy older adults and those with varying stages of AMD, even when traditional clinical metrics and mean pupil size show no difference.
Deep Motivation: The Failure of Averages
In Human-Computer Interaction (HCI), we often use pupillometry to measure cognitive workload: a larger pupil usually means higher mental effort. However, for older adults with ocular diseases, the signal becomes "muted" or "noisy."
The core problem is that standard statistical tools like Task-Evoked Pupillary Response (TEPR) rely on means and variances. They treat the erratic fluctuations of the iris as extraneous noise or "unexplained variance." The authors' key insight was that this "noise" isn't random; it contains a complex, self-similar structure (fractality) that changes as the eye's physiological control mechanisms degrade due to disease.
Methodology: The Wavelet Lens
Instead of looking at the signal at a single scale, the researchers used Wavelet-based Multifractal Analysis. This approach decomposes the PRB time-series into different scales of resolution, calculating Hölder regularity indices (α). These indices describe the local smoothness of the signal.
A signal that is "multifractal" is one where these regularity indices vary significantly over time. The authors focused on the Multifractal Spectrum, specifically the Left Slope (LS).
- Steep LS: Indicates a smoother signal with persistent, slower changes (Healthy Control).
- Shallow LS: Indicates a "rougher," more irregular signal with fast, anti-persistent diameter changes (Severe AMD).
 Table 1: Participant categorization by visual acuity and AMD diagnosis.
Experiments and Results: Seeing the Unseen
The study involved 105 trials of a "drag and drop" task. When looking at the raw pupil diameter (Time-series figures), the difference between a healthy user and an AMD patient is almost imperceptible to the naked eye and traditional stats.
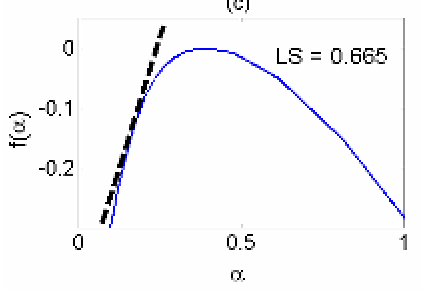 Figure 2: (a & b) show raw PRB data where the two individuals look identical. (c & d) show the multifractal spectra, where the AMD patient (d) exhibits a significantly broader and more complex signature.
The results were striking:
- Monotonic Trend: The LS metric perfectly tracked the severity of the disease. As ocular health decreased, the LS value decreased (increased irregularity).
- Statistical Significance: ANOVA (F = 32.258, p < 0.01) and post-hoc tests confirmed that this method could differentiate between all three groups, a feat impossible with traditional pupillary measures.
Critical Insight & Conclusion
The significance of this work lies in its philosophy: the richness of HCI lies in the complexity of the signal. By moving from "how much" the pupil dilates to "how" it dilates across scales, we can detect implicit interaction needs that users themselves might not be able to articulate.
Takeaway for Designers: As we design for an aging population, our systems must become "physiologically aware." This study provides the mathematical toolkit to transform erratic physiological data into actionable diagnostic signatures, paving the way for adaptive interfaces that respond to a user’s specific ocular health status in real-time.
Limitations: The sample size is relatively small (n=28 total). While the statistical significance is high, broader validation is needed to ensure these "signatures" are unique to AMD and not general signs of fatigue or other neurodegenerative conditions.