
Deciphering the Digital Gaze: Eye Tracking Analysis of Social Network Behavior
Eye Tracking Analysis of User Behavior in Online Social Networks
This study presents an eye-tracking analysis of user behavior on social networking sites (SNS), specifically Facebook. Using a Tobii T60 eye tracker, the research identifies the "Wall Post" area as the primary focal point for user attention and "Reading Friends' Status" as the dominant activity.
TL;DR
This study moves beyond traditional surveys to use Eye Tracking technology to see what users actually do on Facebook. The findings are conclusive: the "Wall Post" area is the undisputed gravity center of social media, capturing initial attention and the majority of session time. While users perform various tasks, reading status updates remains the primary driver of engagement.
Background Positioning
In the landscape of User Experience (UX) research, this paper acts as a bridge between qualitative sociology and quantitative physiology. Instead of asking users what they liked (which is prone to recall bias), the researchers measured the foveal vision of participants to map the subconscious hierarchy of social media interfaces.
Problem & Motivation: The Limits of "Self-Reporting"
Why do we need lasers and infrared cameras to study Facebook? Most prior research (e.g., Hampton et al.) relied on surveys where users estimated their time spent liking or commenting. However, human attention shifts in milliseconds. The authors argue that to truly "model" user behavior, we must understand the Information Foraging process—how eyes scan for "scent" (relevant content) before a click ever occurs.
Methodology: The Science of the Sequence
The researchers utilized a Tobii T60 eye tracker to monitor eight participants as they navigated Facebook. They transformed the chaotic act of "browsing" into measurable data by defining six Areas of Interest (AOIs):
- Navigation Bar
- Applications
- Groups
- Wall Posts (The central feed)
- Advertisements
- Chat Rooms
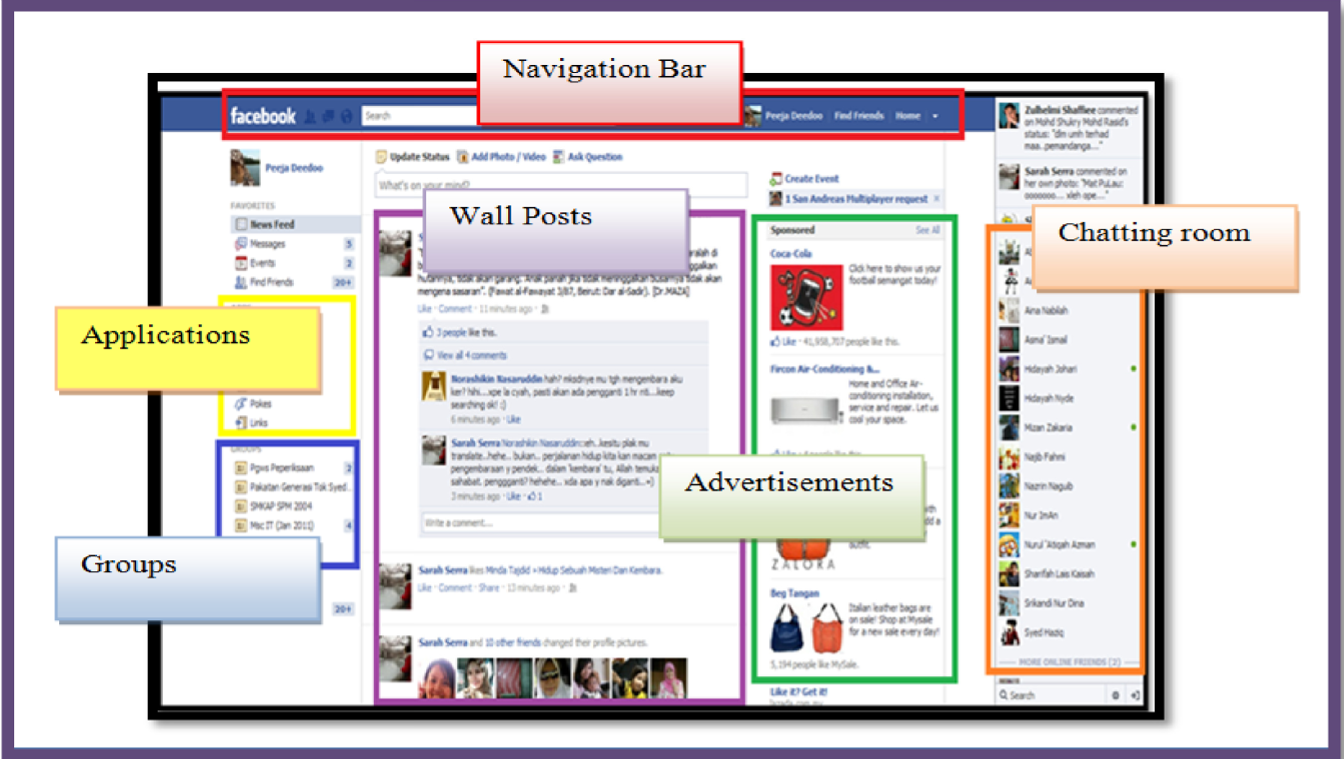 Figure 1: The Facebook layout divided into Areas of Interest (AOIs) for spatial analysis.
The study utilized Gaze Plots to track the chronological path of the eye and Heat Maps to aggregate duration, providing a "thermal" view of what was ignored versus what was scrutinized.
Key Insights and Results
1. The Power of the Center
The results were remarkably uniform. For every single participant, the Wall Post was the "Point of Attraction" (the first place they looked). This suggests a strong Inductive Bias in web design where users have been conditioned to ignore sidebars (often associated with "Banner Blindness" for ads) and focus immediately on the center.
2. Status Reading is the "Killer App"
While social networks offer chatting, photos, and links, the screen recording data revealed that reading friend statuses is the main activity. The "social grooming" aspect of passive consumption is the engine that keeps users on the platform.
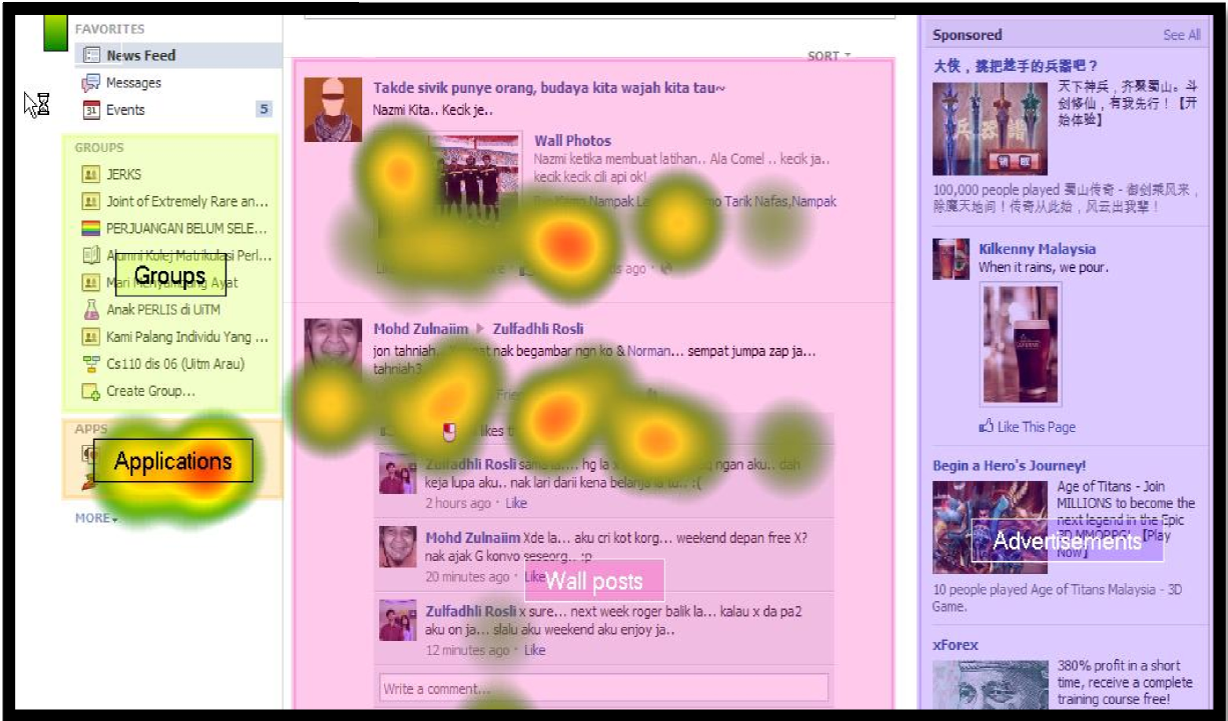 Figure 2: Heat map showing the intense concentration of gaze on the central wall area, with almost total neglect of the side columns.
3. Expertise and Efficiency
The study confirmed a significant correlation between how often a person uses the site and their completion time. Experienced users don't "browse"—they "target." They have a mental map of the interface that allows them to skip the scanning phase and move directly to interaction.
Critical Analysis & Conclusion
Takeaway
The "Wall" is not just a feature; it is the interface. The study proves that users have a highly localized focus. For developers and marketers, this means that any content placed outside the central 40% of the screen horizontal real estate is at high risk of being completely ignored by the user's conscious attention.
Limitations & Future Work
The study’s sample size (n=8) is small and focused on postgraduate students. Future research should explore:
- Culture & Demographics: Do different cultures (e.g., Eastern vs. Western) scan interfaces differently?
- Mobile vs. Desktop: How does the "Gaze" change on a vertical smartphone screen where sidebars don't exist?
- Algorithmic Impact: How do "Auto-play" videos disrupt the traditional scanning patterns identified here?
In conclusion, eye tracking provides a "ground truth" for UX design, proving that in the battle for attention, the central feed is the only front that truly matters.