
f-PageRank: Decoding Influence and Bottlenecks in Business Process Networks
Identifying Key Resources in a Social Network Using f-PageRank
The paper introduces f-PageRank, a frequency-aware centrality measure designed to identify key resources in business process social networks. By modifying the original PageRank algorithm to account for multiple "work handover" events between the same resources, the method achieves superior identification of bottleneck-prone performers compared to standard metrics like Degree or Betweenness centrality.
TL;DR
In a world of complex business processes, not all "connections" are created equal. This paper introduces f-PageRank, a specialized algorithm that identifies key resources in a social network by factoring in the frequency of work handovers. Tested on massive industrial datasets, it outperforms traditional graph-theoretic measures by revealing the true "power players" and potential bottlenecks in production lines.
Background: Beyond the Static Graph
Social Network Analysis (SNA) is usually associated with Facebook or Twitter, but in industrial engineering, it is a vital tool for process mining. By analyzing event logs, we can see how work moves from "Pete" to "Sue" or from "Machine A" to "Machine B."
The authors argue that the classic PageRank algorithm—while revolutionary for web search—is ill-suited for business processes. Why? Because PageRank treats every link as a single vote. In a factory, if Machine A sends parts to Machine B 1,000 times, that link is significantly more important than a one-off transfer. Ignoring this frequency leads to a "flat" understanding of the network where critical hubs remain hidden.
The "Frequency" Insight (Methodology)
The core innovation is deceptively simple but mathematically robust: f-PageRank.
The standard Google PageRank calculates importance based on the number and quality of in-links. The authors modify this by adding a frequency coefficient . This ensures that if a resource is a frequent destination for work from an influential source , its importance score scales proportionally.
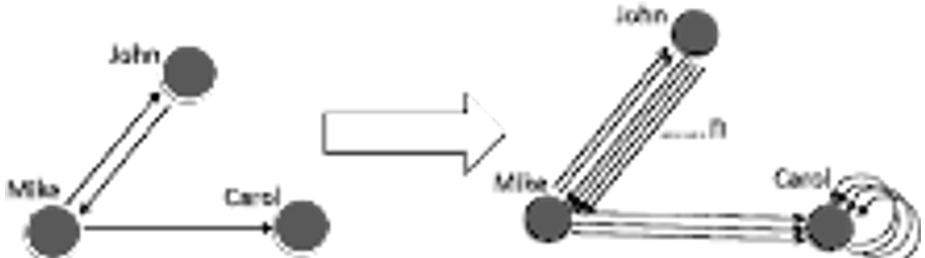 Figure 1: (a) Original PageRank vs. (b) f-PageRank. Note how multiple handovers are collapsed in the standard model but preserved in the frequency-based model.
The researchers ensure that the transition matrix remains stochastic (columns sum to 1), allowing the algorithm to converge via the standard power iteration method.
Proving Value: From Repair Shops to Steel Mills
The authors validated their approach using two distinct datasets:
- LD-1 (Repair Process): A medium-sized log where f-PageRank identified the "System" and "Testers" as central, while traditional metrics like HITS or BaryRanker gave many unrelated nodes identical scores.
- LD-2 (Steel Manufacturing): A massive log comprising 380,000 events.
The Steel Mill Discovery
In the steel manufacturing case study, the results were striking. While structural measures like Degree Centrality pointed to "M-AN1" as the key resource, f-PageRank highlighted M-CRC (Cold Rolling) and M-ANA.
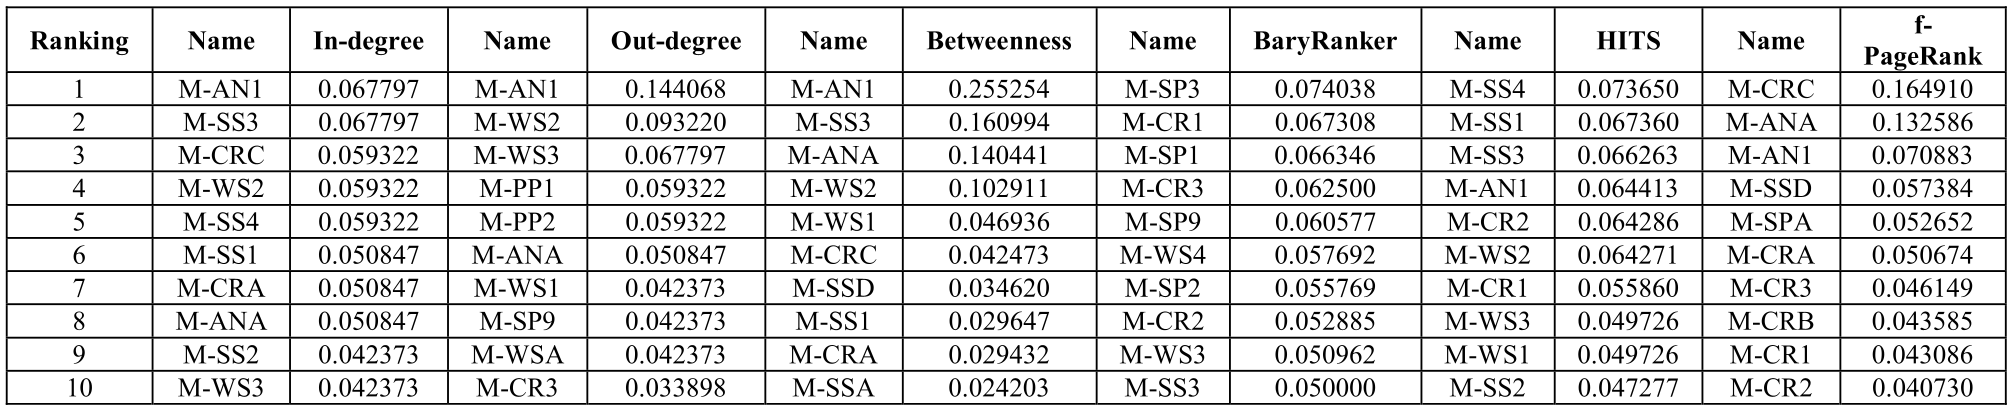 Table 1: Comparing centrality rankings. Notice how f-PageRank (last column) provides a distinct ranking that aligns with actual process activity volume.
Why does this matter? M-CRC serves as the physical bridge between two factory locations. Even if its "connectivity" looks similar to other nodes, its throughput is much higher. f-PageRank captures this "communication activity," making it a far superior predictor of where a bottleneck is likely to occur.
Critical Analysis & Conclusion
Takeaway
The paper successfully demonstrates that in business environments, power = connectivity × frequency. By moving from a topological view to an activity-based view, f-PageRank provides managers with a "heat map" of where process supervision is most needed.
Limitations
- The Weight Problem: Currently, all handovers are weighted equally. In reality, some tasks are "heavier" (take longer) than others.
- Temporal Blindness: The model looks at total frequency over time but doesn't account for bursts of activity or seasonality.
Future Work
The authors hint at integrating waiting times into the model. Imagine a system that not only knows who is important but also calculates the "diffusion of delay"—how a 10-minute slowdown at a key f-PageRank hub ripples through the entire global supply chain.