
Footprints at School: Decoding In-class Social Dynamics through Positioning Traces
Footprints at School: Modelling In-class Social Dynamics from Students’ Physical Positioning Traces
The paper introduces a longitudinal approach to modeling in-class social dynamics using granular x-y physical positioning data from wearable Bluetooth Low Energy (BLE) tags. Conducted over eight weeks with 98 students and six teachers, the study utilizes Social Network Analysis (SNA) to extract cohort-level and individual-level metrics, effectively identifying pedagogical impacts and students at risk of social isolation.
TL;DR
This study bridges the gap between physical space and digital analytics by tracking 98 students and 6 teachers over 8 weeks using BLE-based indoor positioning. By applying Proxemics and Social Network Analysis (SNA), the researchers successfully modeled how different subjects (e.g., Reading vs. Maths) influence social cohesion and developed an early-warning method to identify students trending toward social isolation.
The "Physicality" Gap in Learning Analytics
While we can easily track a student's every click on an LMS, the physical classroom remains a "black box" regarding social behavior. Traditional ethnography is too labor-intensive for long-term monitoring, and previous sensing attempts using WiFi or Video often suffered from low precision or visual occlusion. The authors argue that physical proximity is one of the strongest predictors of social ties—a concept known as Proxemics.
Methodology: From Coordinates to Social Ties
The researchers transformed raw x-y coordinates into social insights through a four-step pipeline:
- Interpolation: Filling gaps in tracking data caused by signal occlusion.
- Euclidean Distance Calculation: Measuring distances between all participant pairs every second.
- The 1-Meter Rule: Defining interaction as being within 1 meter for at least 10 consecutive seconds.
- Graph Construction: Building social networks where nodes are people and edges represent interaction duration.
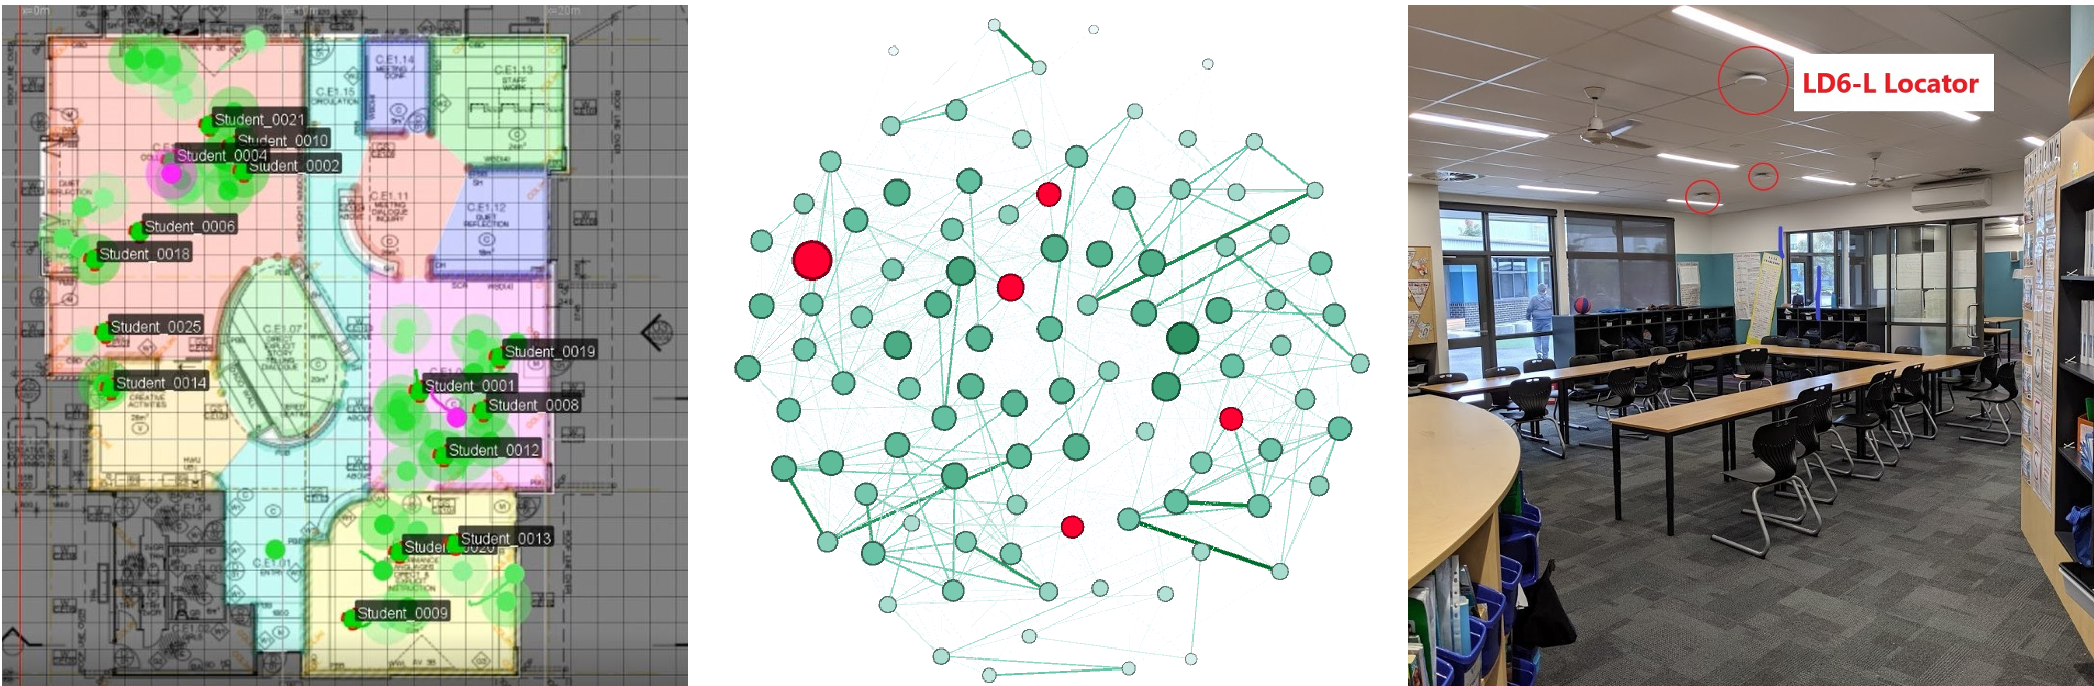 Figure 1: From the physical learning space (left) to the modeled social network (middle) and the hardware locators (right).
Key Insights: Pedagogy and Productivity
1. Subject-Specific Social Signatures
The study found that "Reading" and "English" had significantly higher network density and triadic interactions (groups of three) than "Maths" or "Spelling." This confirms that teaching strategies—even in an open-plan building without walls—dictate social structure more than the physical layout itself.
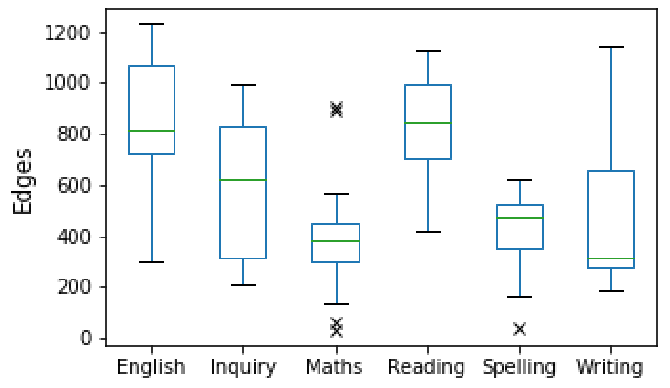 Figure 2: Boxplots showing higher social "Edges," "Density," and "Positive Triads" in group-oriented subjects like Reading.
2. Identifying Social Risk (The Case of "Decline")
Perhaps the most impactful finding was the ability to cluster students based on their social trajectory. While most students remained "Consistent" or "Improved," a specific cluster showed a marked "Decline."
The authors highlight Student 98, whose social interactions plummeted mid-term. By examining her Ego Network, they discovered that a "Strong Tie" with another student (Student 86) suddenly severed and was never replaced, signaling a potential peer conflict that required teacher intervention.
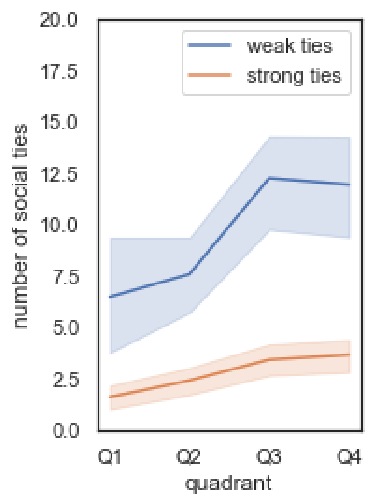 Figure 3: (d) showing the declining social trend in a subset of students over the 8-week period.
Critical Analysis & Future Outlook
Strengths: This is the first study of its kind to combine high-precision tracking with a large sample (>100) over a longitudinal period (8 weeks). The use of SNA provides a mathematically robust way to interpret "noisy" positioning data.
Limitations: Proximity does not always equal meaningful interaction. Two students sitting near each other but ignoring one another might be falsely identified as a "tie." Furthermore, ethical concerns regarding surveillance in schools must be addressed before such systems are deployed at scale.
Conclusion: "Footprints at School" proves that the "Physical Positioning Trace" is a powerful new modality for Learning Analytics. It moves us away from self-reported data toward an objective, real-time understanding of how students live, learn, and socialize in the modern classroom.