
Beyond Snapshots: Mining "Interesting" Trends in Dynamic Social Networks
Finding “interesting” trends in social networks using frequent pattern mining and self organizing maps
The paper proposes a hybrid analytical framework combining TM-TFP (Trend Mining Total from Partial) frequent pattern mining with Self-Organizing Maps (SOM) to detect and visualize dynamic trends in social networks. Evaluated on the GB Cattle Tracing System and insurance datasets, it successfully identifies "interesting" trends by measuring the migration distance of patterns across a sequence of SOMs.
TL;DR
Most social network analysis is stuck in "freeze-frame" mode. This paper introduces a powerful workflow that combines Frequent Pattern Mining with Self-Organizing Maps (SOM) to track how network behaviors evolve over time. By measuring how specific patterns "migrate" across neural maps, the system automatically flags the most significant—or "interesting"—behavioral shifts in massive datasets.
Problem & Motivation: The "Tsunami" of Data
Traditional data mining is excellent at finding what is happening right now, but it often fails to explain how things are changing. In complex social networks—like the movement of cattle across a country or insurance quote requests—the data is high-dimensional and time-stamped.
The authors identify two major pain points:
- Dynamic Blindness: Static "snapshots" miss the seasonal and evolutionary trends of a network.
- Information Overload: Lowering the "interest" threshold in frequent pattern mining can result in over 60,000 trend lines. No human analyst can find the needle in that many haystacks.
The Research Insight: We shouldn't look for trends in isolation. Instead, we should cluster similar trend "contours" and watch how these clusters morph over time.
Methodology: The TM-TFP to SOM Pipeline
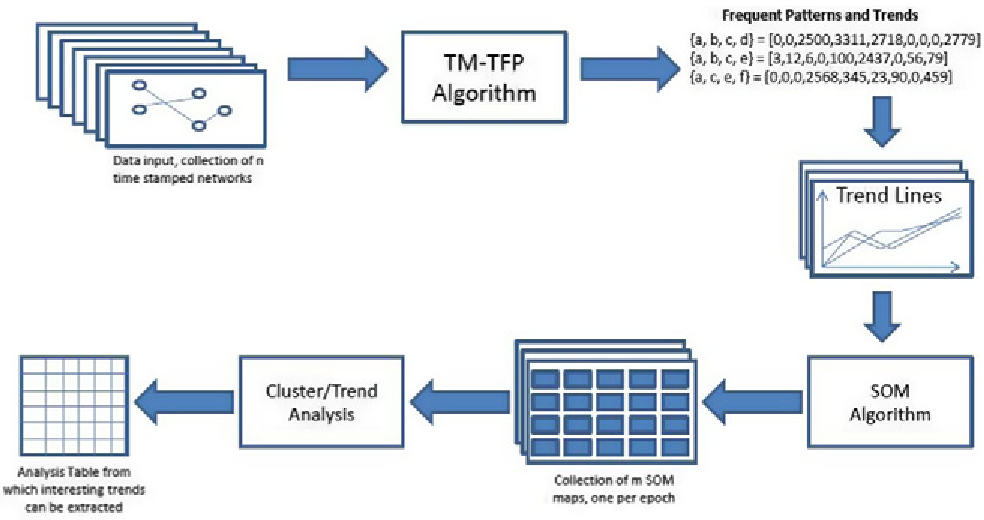
The architecture relies on a specialized algorithm called TM-TFP (Trend Mining Total from Partial). It ignores absolute values to focus on "Support Values"—how often a specific pattern (e.g., [Large Engine + Female Driver + Region CH]) occurs in a given month.
1. The TM-TFP Architecture
The system uses a T-tree structure to store temporal frequent patterns across "epochs" (typically 12-month cycles).
2. Clustering via Self-Organizing Maps (SOM)
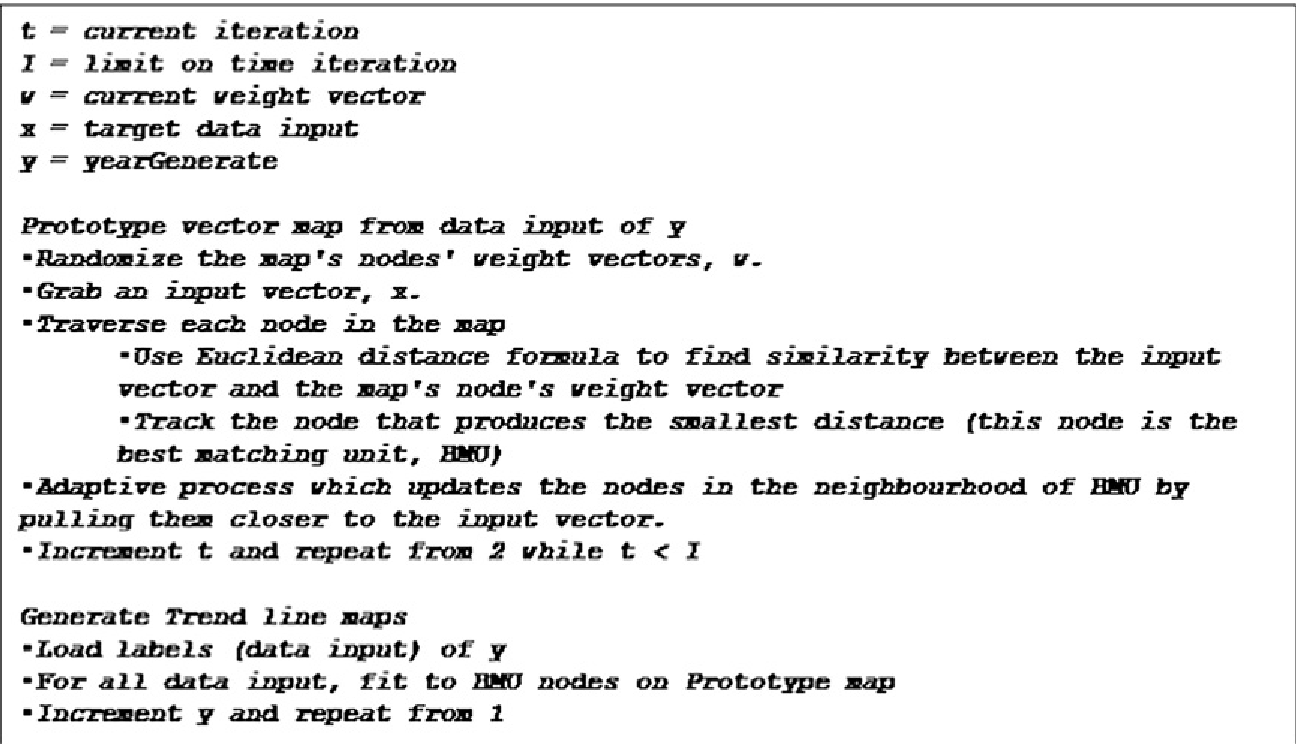
To handle the 60k+ trend lines, the authors employ Kohonen Maps (SOM). Unlike standard K-means, SOMs preserve the topology of the data. Similar trend shapes (e.g., trends that peak in Spring) are mapped to neighboring nodes.
3. Measuring "Interestingness"
The core innovation is Migration Analysis. If a pattern is in Node 1 in Year 1, but jumps to Node 44 in Year 2, it indicates a radical change in behavior. The distance of this jump is the "Interestingness Score."
Experiments & Results
The authors validated their approach on two "Star" networks:
- Cattle Tracing System (GB): Tracking 400,000 movements per epoch.
- Deeside Insurance: Tracking insurance quotation habits.
Key Findings:
In the Cattle network, the system correctly identified "seasonal clusters." For example, Node 1 represented patterns peaking in both Spring and Autumn, while Node 43 represented a unique "Spring-only" movement.
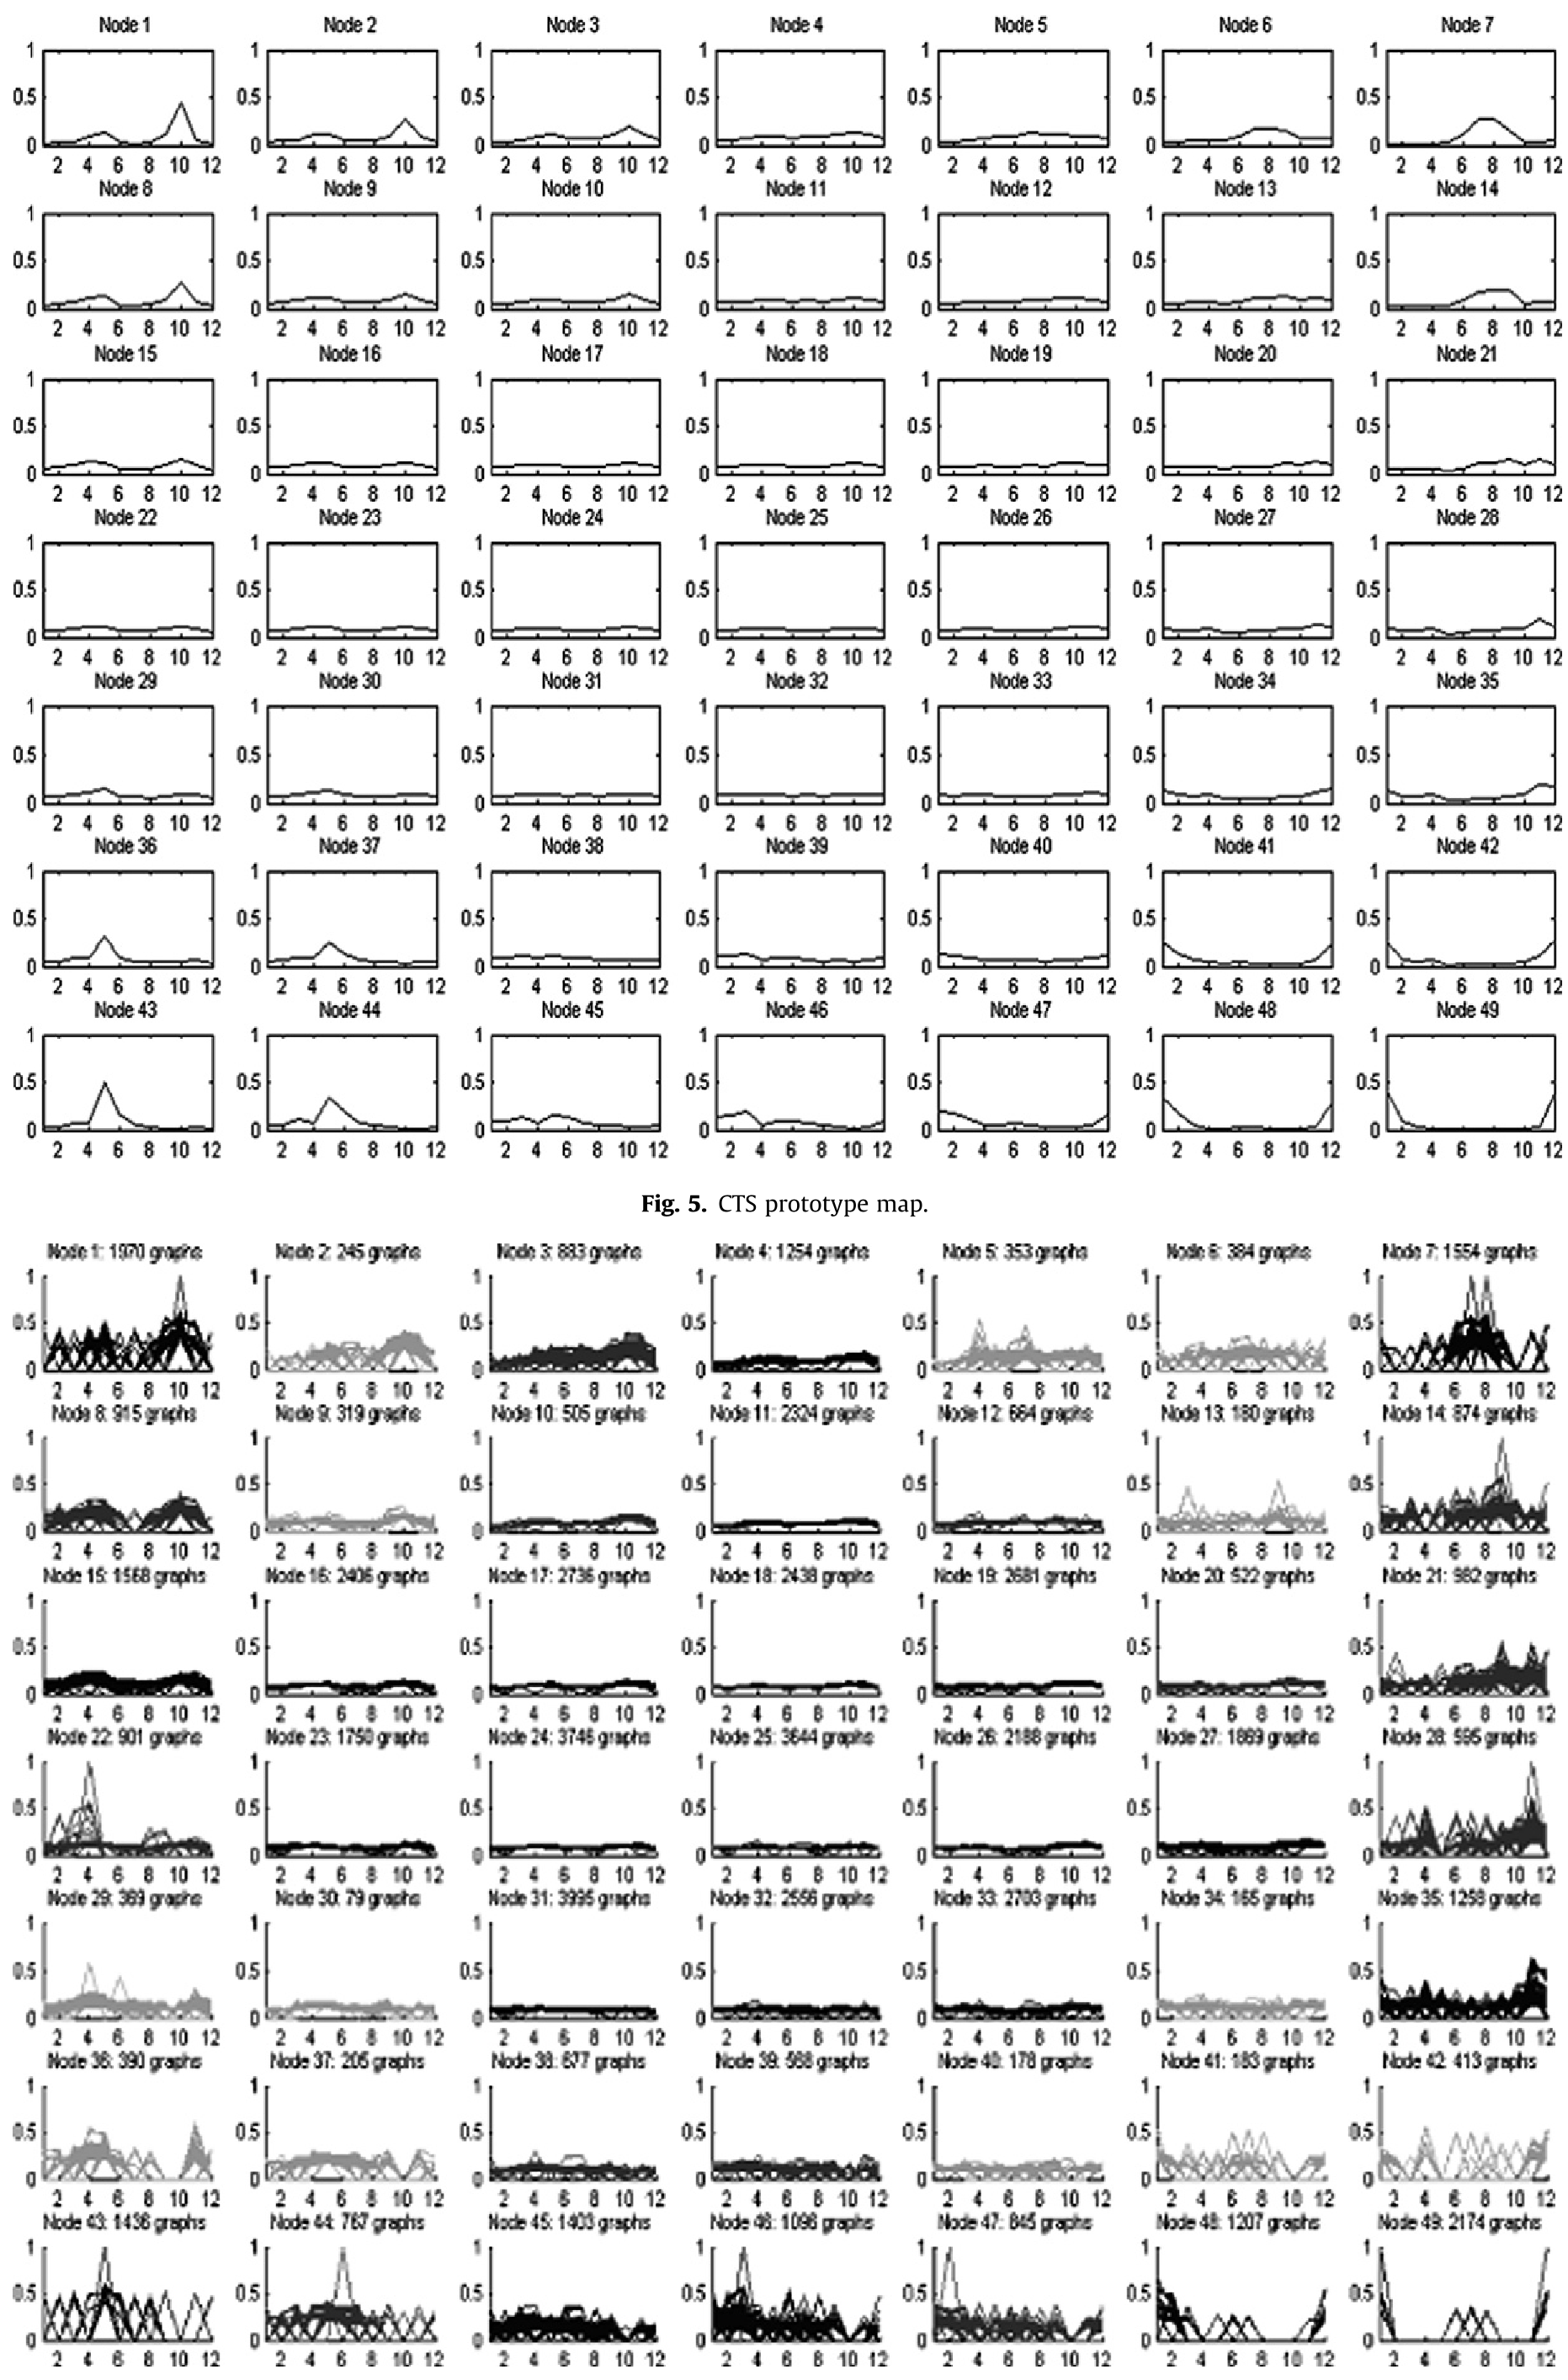
The Ablation Study using "Meta-patterns" (Spatial vs. Non-spatial) allowed the researchers to filter the data further, reducing the cognitive load on decision-makers by categorizing patterns by sender/receiver attributes.
Critical Analysis & Conclusion
Value-First Takeaway: This work transitions frequent pattern mining from a "descriptive" tool to a "diagnostic" one. By quantifying the migration of patterns, it provides a mathematical basis for "Interestingness" that isn't just based on absolute frequency, but on rate of change.
Limitations:
- The SOM size () is still a heuristic choice.
- The model assumes epoch lengths are predefined (e.g., 12 months), which might miss "bursty" trends that don't fit calendar cycles.
Future Outlook: Integrating this with Predictive Analytics could allow the system to not just report on migrations that have happened, but forecast where a trend will land on the SOM next year—a potential game-changer for fraud detection and epidemic monitoring.