
GED: Bridging Quantity and Quality in Social Group Evolution
GED: the method for group evolution discovery in social networks
The paper introduces GED (Group Evolution Discovery), a novel method for tracking the dynamics of social groups in temporal networks. By utilizing a unique "inclusion measure" that accounts for both member quantity and quality (social importance), GED achieves State-of-the-Art performance in identifying seven types of group evolutionary events.
TL;DR
Tracking how social groups change over time is a multi-dimensional challenge. This paper presents GED (Group Evolution Discovery), a method that moves beyond simple member-counting to include "Social Position" as a weight for group transitions. GED is significantly faster, more flexible across different clustering algorithms, and more accurate in capturing the nuanced lifecycle of social communities.
The Evolution Gap: Why Overlap is Not Enough
In the study of Social Network Analysis (SNA), groups are not static. They breathe—expanding, splitting, and sometimes dissolving entirely. Previous SOTA methods followed a "counting" logic: if 50% of people overlap, it’s the same group.
However, the authors identify a critical flaw: Member Equality is a myth. A group that loses its five most influential leaders is fundamentally different from a group that loses five inactive members, even if the "quantity" of loss is the same. Existing frameworks like Asur's were too rigid, and Palla’s approach, while comprehensive, was computationally prohibitive for large-scale dynamic networks.
Methodology: The Inclusion Measure
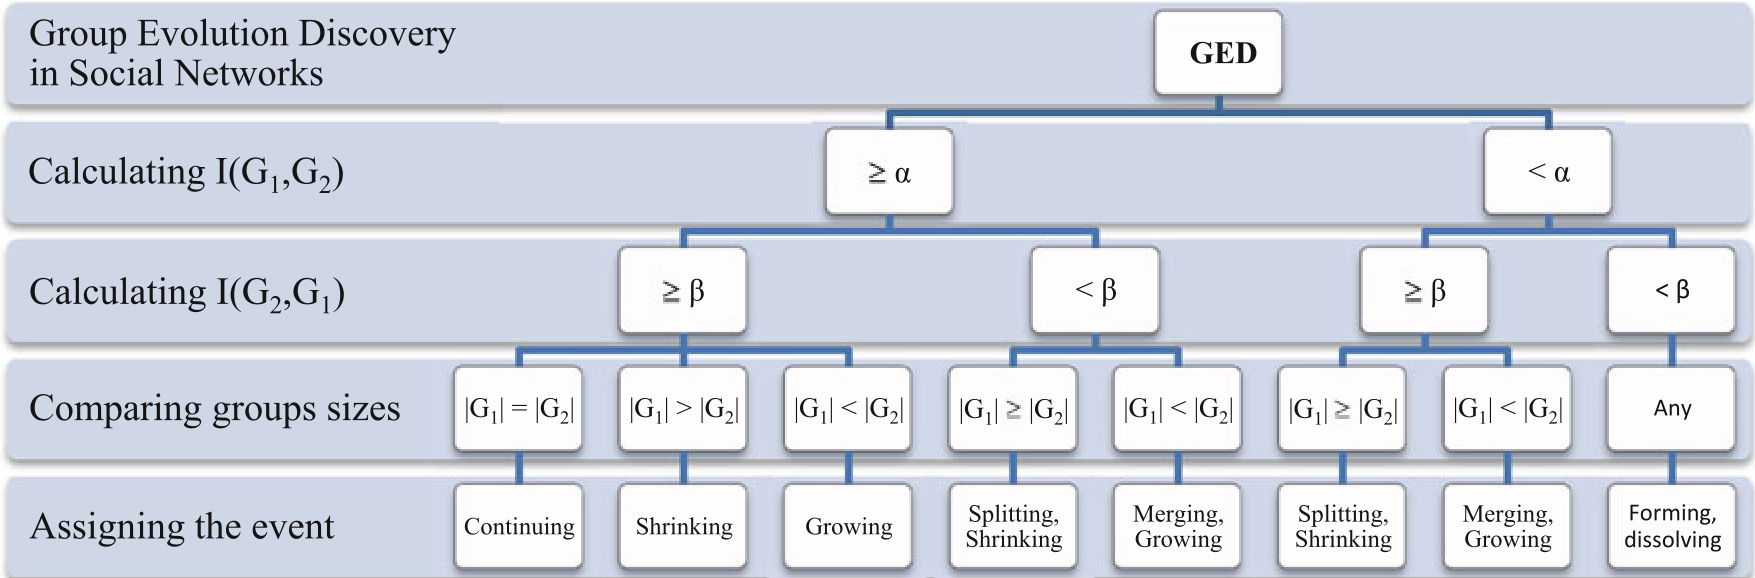
The heart of the GED method is the Inclusion Measure . It calculates the "belongingness" of one group in another using a dual-factor formula:
- Group Quantity (Left Factor): The standard overlap ratio.
- Group Quality (Right Factor): The ratio of the "Social Position" (centrality) of the overlapping members.
By using these factors, GED can identify seven distinct events: Continuing, Shrinking, Growing, Splitting, Merging, Dissolving, and Forming.
Experimental Battleground: Email Communication Networks
The authors tested GED on 14 months of university email data. They compared it against:
- Asur et al.: An event-based framework.
- Palla et al.: A clique percolation-based matching method.
Performance Benchmarks
GED demonstrated superior efficiency and granularity:
- Execution Speed: A single run of GED took only 6 minutes, compared to 5.5 hours for Asur's method.
- Flexibility: Unlike competitors, GED was tested on both overlapping (CPM) and disjoint (Blondel/Louvain) groups, proving it is agnostic to the underlying community detection algorithm.
Sensitivity Analysis
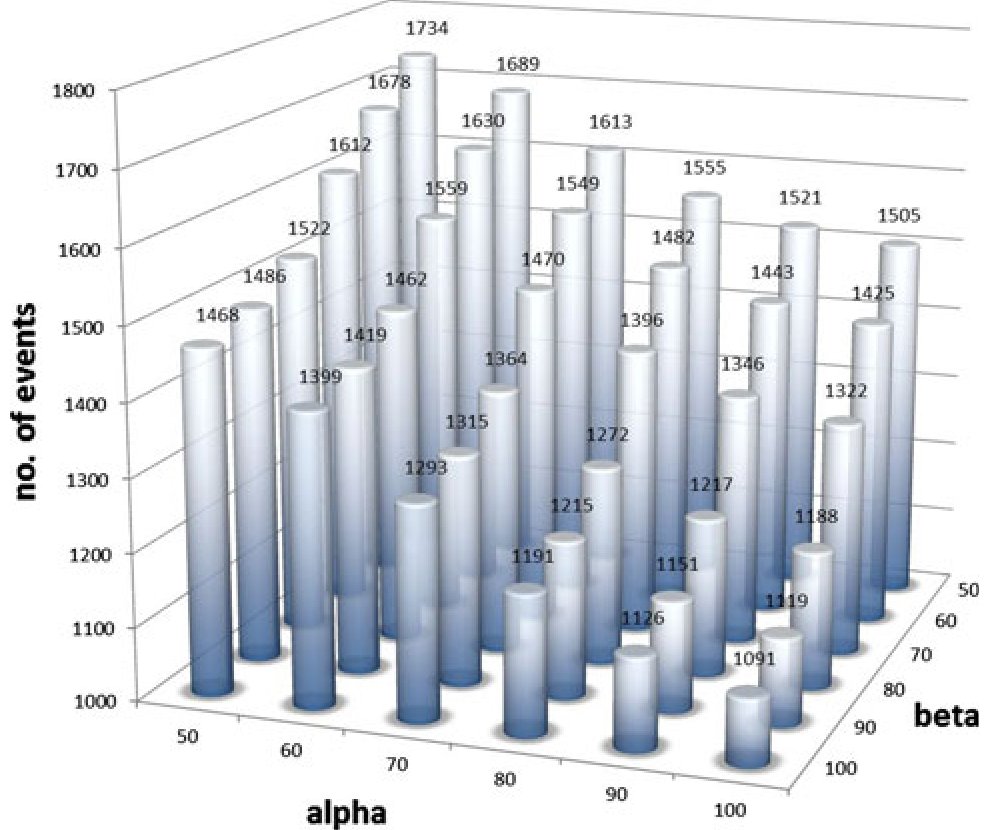
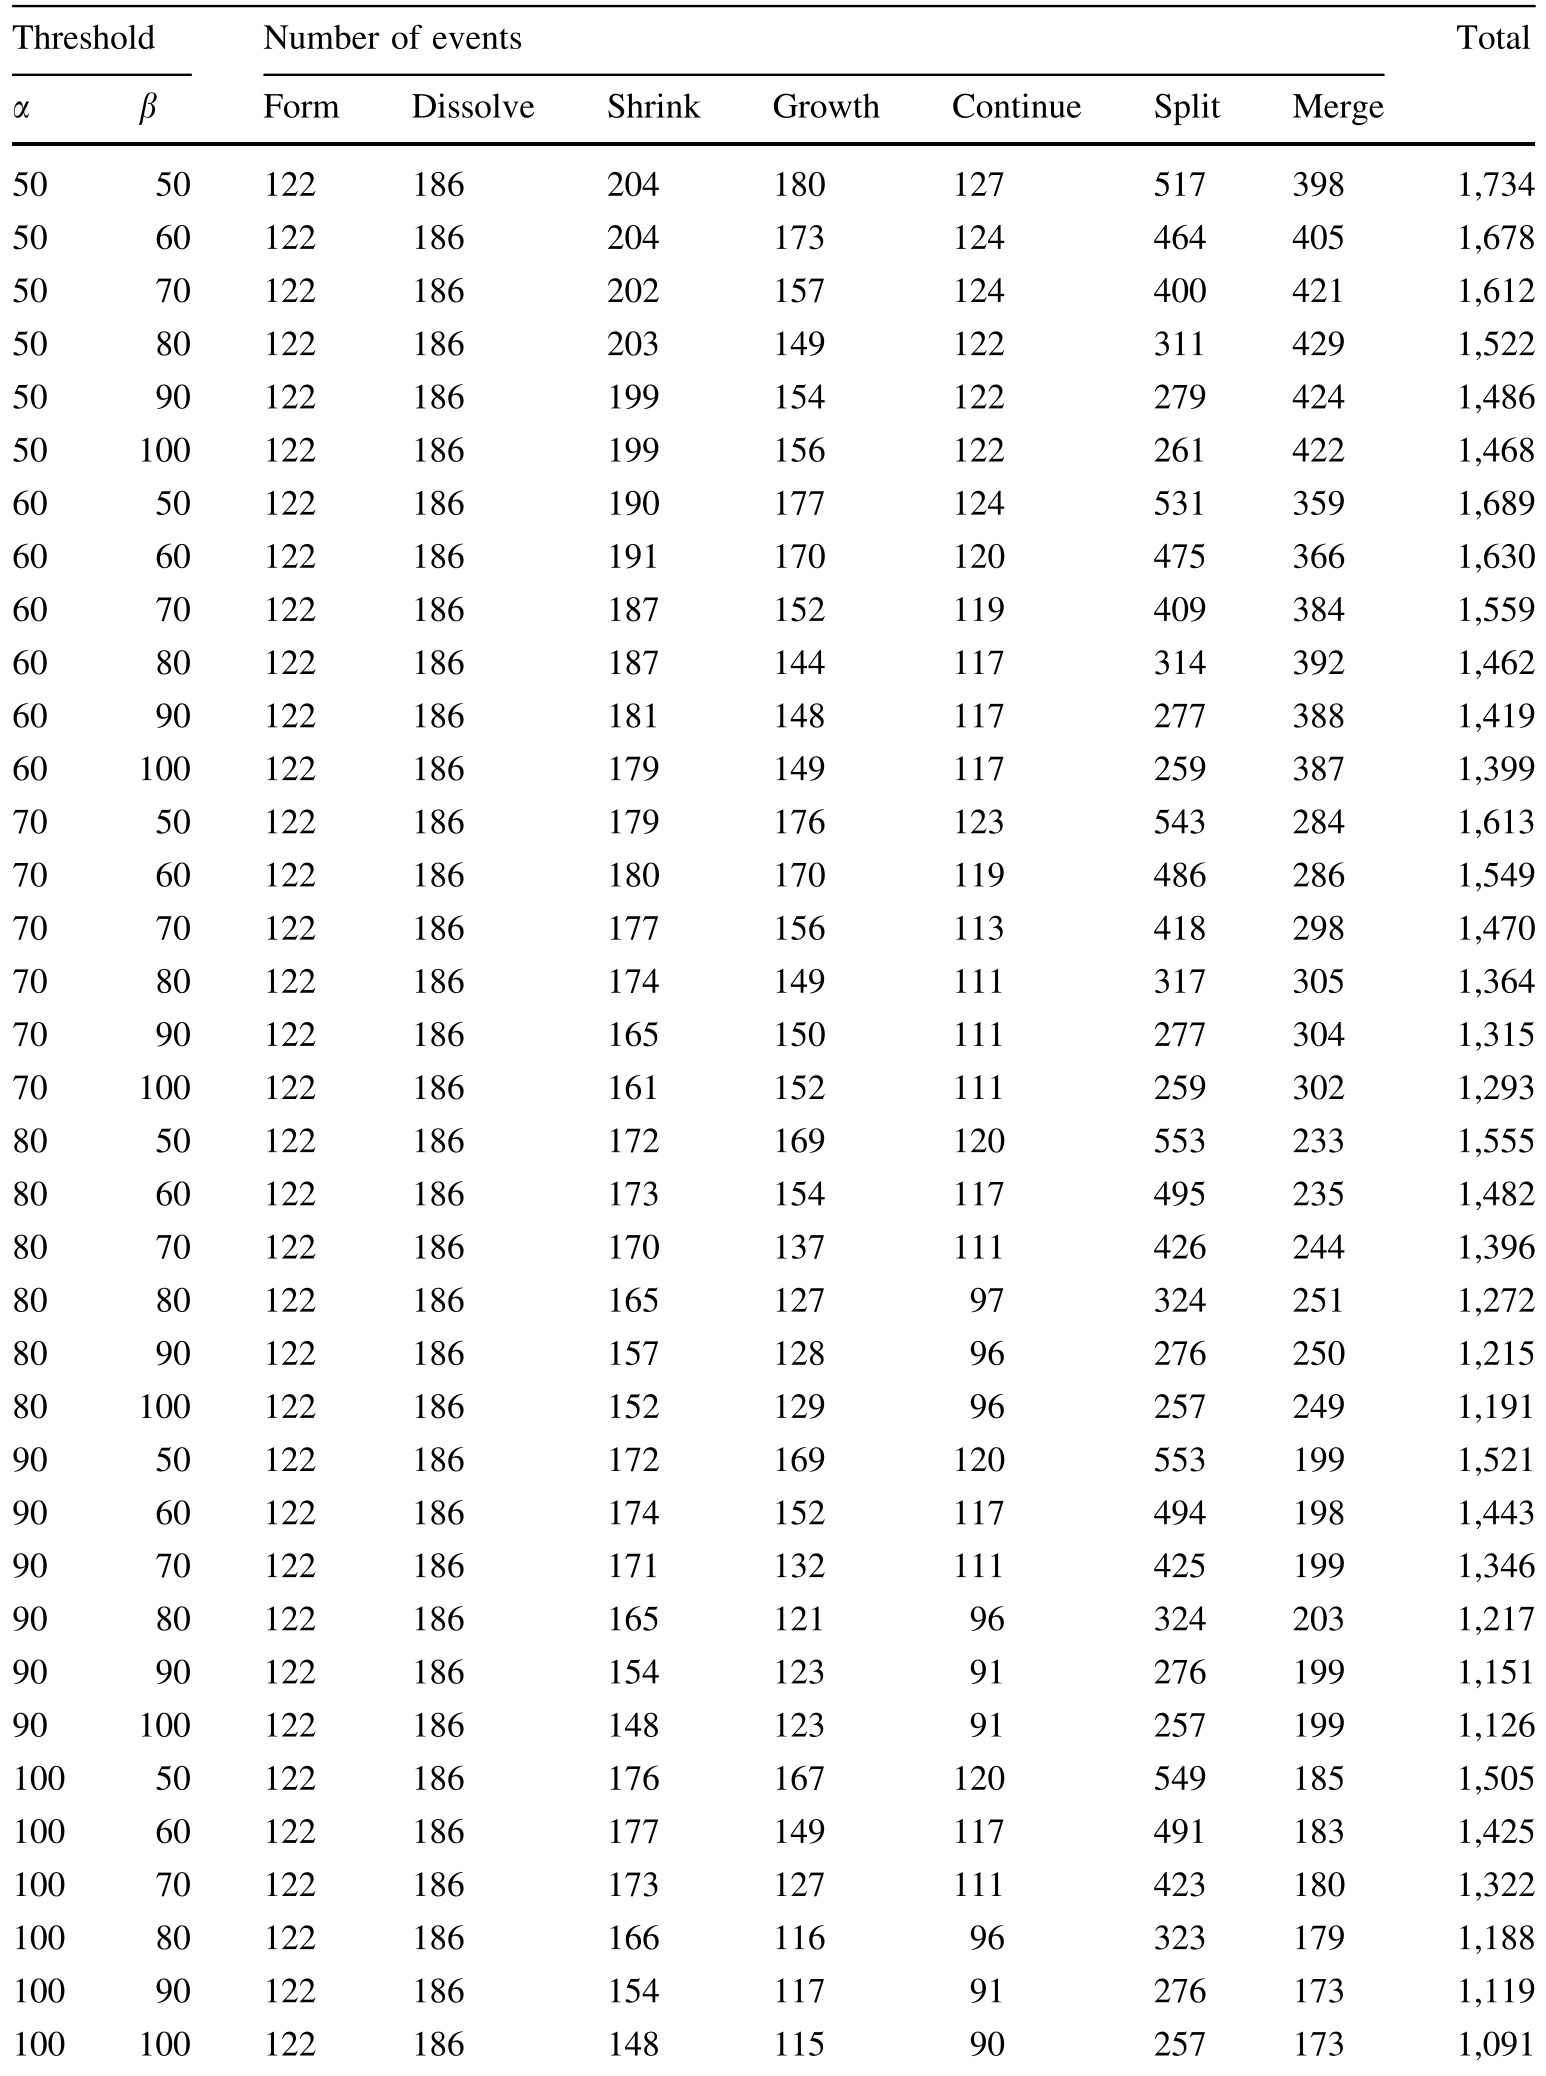
The parameters and allow researchers to tune how "strict" the event matching should be. As shown in the tables below, the method provides a linear and predictable response to threshold changes, allowing for specific filtering of noise in highly dynamic networks.
Critical Insight & Conclusion
The true value of GED lies in its Inductive Bias: the assumption that the "core" of a group (the high-centrality members) defines its identity more than its "periphery." This physical intuition allows the model to ignore minor churn (peripheral members leaving/joining) while accurately triggering a "Split" or "Dissolve" event when the structural backbone of a group breaks.
Limitations: While powerful, the method’s accuracy is still dependent on the quality of the initial community detection and the chosen centrality measure. Future iterations might benefit from automated parameter () optimization using machine learning to adapt to different network topologies automatically.
Bottom Line: For anyone building churn prediction models or community management tools, GED provides a robust, mathematically sound, and computationally efficient framework for tracking the "heartbeat" of social groups.