
The Scale Paradox: How Geographic Aggregation Silences Crisis Data
The Impact of Geographic Scale on Identifying Different Social Media Behavior Extremes in Crisis Research
This study investigates how geographic aggregation scale influences the identification of social media behavior extremes during crises, specifically focusing on Hurricane Harvey in Houston. Using Twitter data across twelve distinct hexagonal spatial nets, the authors established scale-dependent power law relationships for identifying abnormal bursts and drop-offs in activity.
TL;DR
When disaster strikes, we look to social media "heatmaps" to find the hardest-hit areas. However, a new study reveals that the scale of our map determines which stories we hear. By analyzing Hurricane Harvey data through twelve different "spatial nets," researchers found that while larger scales make activity bursts easier to see, they effectively "mute" the areas that fall silent due to severe damage—potentially biasing resource distribution away from the most vulnerable zones.
Contextual Positioning
This work acts as a critical methodological intervention in the field of Crisis Informatics. While previous SOTA research focused on what social media says about disasters, this paper interrogates how the spatial container (the scale) alters the message. It moves the conversation from simple "big data" quantification to a more nuanced "sociospatial" critique.
The "Silence" Problem & Motivation
Most disaster response tools look for bursts: a sudden spike in Tweets usually signals an event. But there is a more ominous signal: silence. When power grids fail or flooding becomes catastrophic, social media activity doesn't spike; it vanishes.
The authors argue that prior work has a blind spot regarding geographic scale. If you aggregate data at the city or ZIP code level, a localized "pocket of silence" (indicating extreme damage) is often averaged out by neighboring areas that are still tweeting. To solve this, the researchers asked: How exactly does the scale of our analysis change our ability to see these two extremes (bursts vs. silence)?
Methodology: High-Resolution Spatial Nets
To test their theory, the authors reconstructed the population of Houston at a 30-meter resolution using land-cover data and census regression. They then draped "spatial nets" of hexagons—ranging from tiny 0.25 km² blocks to large 80 km² regions—over the city.
The Analytical Engine: Steady State vs. Perturbed State
- Steady State: Use 5 weeks of pre-hurricane data to build a baseline "normal" for every single hexagon.
- Perturbed State: Analyze the week of Hurricane Harvey landfall.
- CDF Probability: For every hexagon, calculate the probability of seeing that day’s tweet count based on its own history.
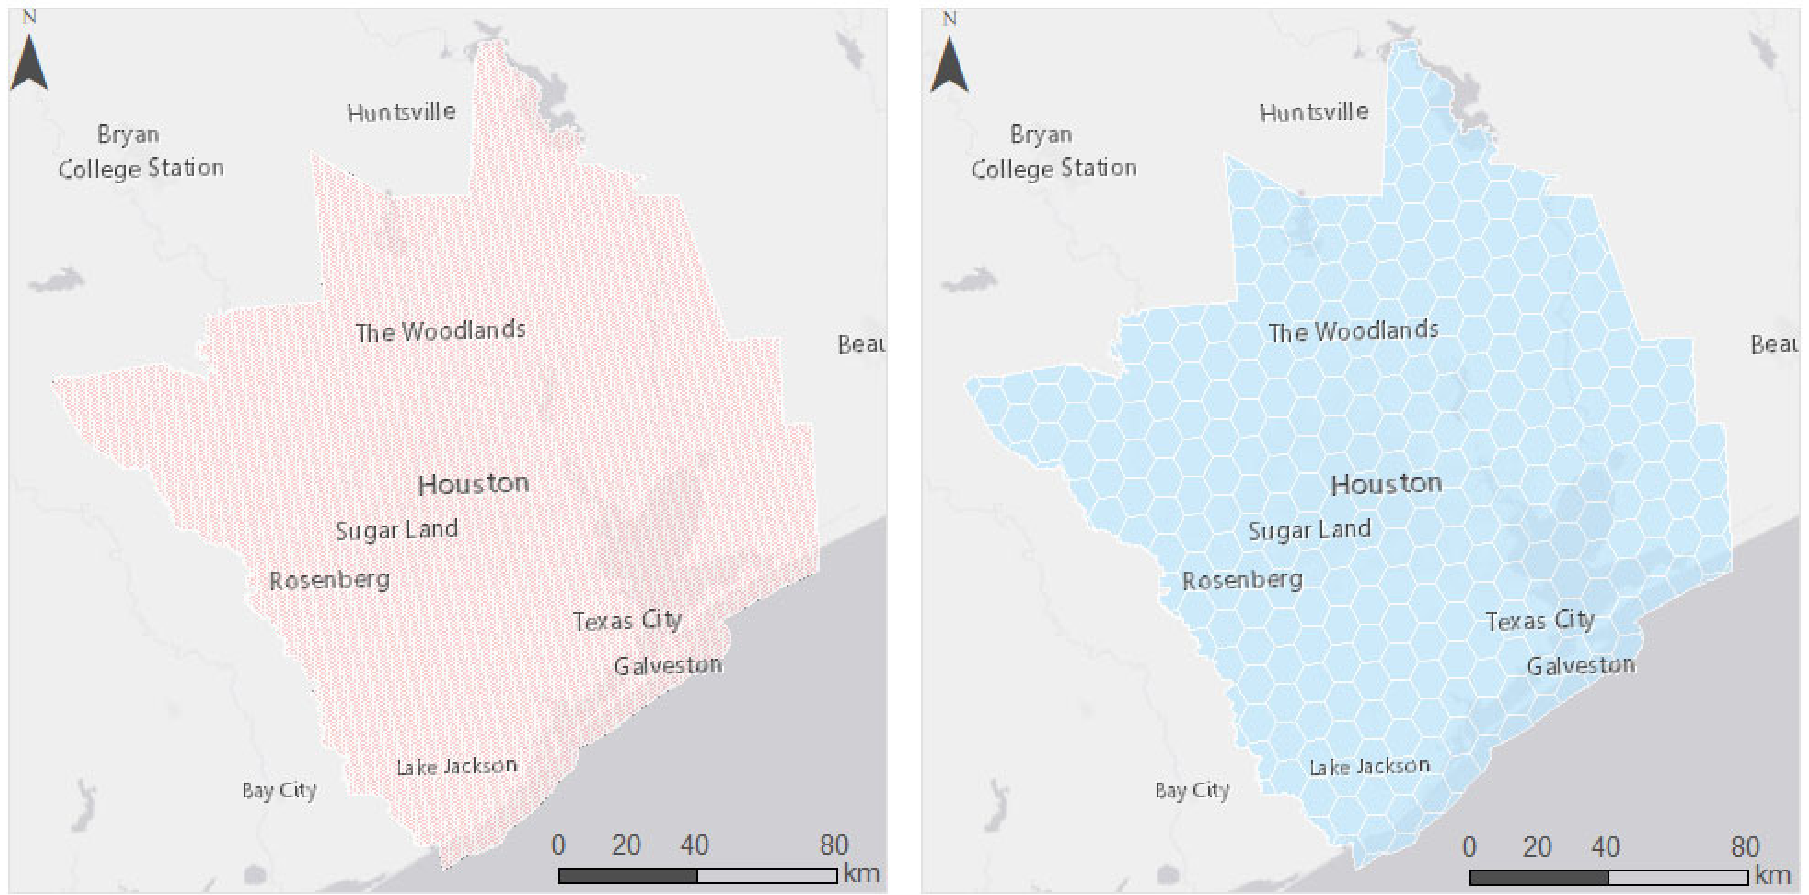 Figure 1: Comparison of a 1 km² net (high resolution) vs. an 80 km² net (low resolution).
Key Results: The Inverse Power Law
The most striking finding was the Power Law Relationship. As the geographic scale increases:
- Extremely High Behavior: Becomes easier to identify (Positive relationship).
- Extremely Low Behavior: Becomes harder to identify (Negative relationship).
Essentially, as you zoom out, the "noise" of many people tweeting masks the "silence" of the few who cannot.
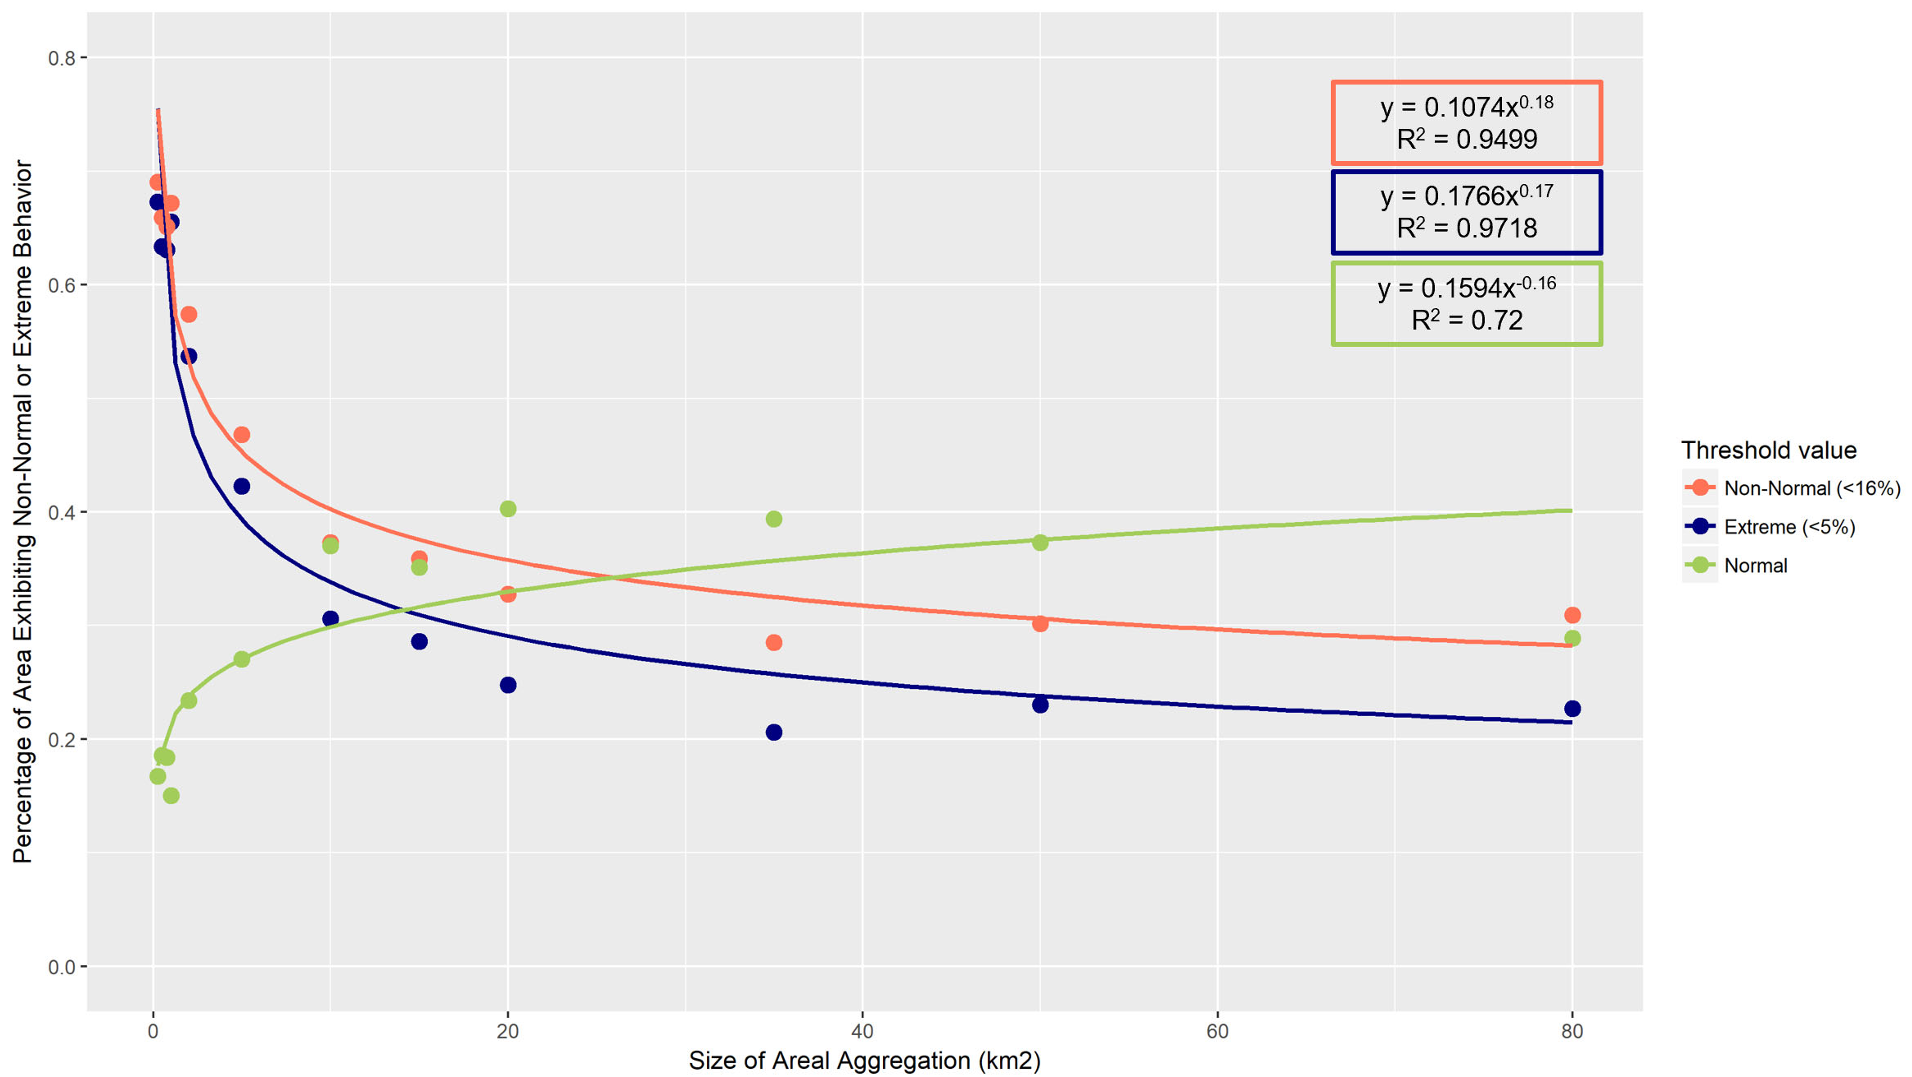 Figure 2: The percentage of identified "low activity" areas drops sharply as the aggregation scale increases.
Critical Insights & Takeaways
1. The Equity Hazard
The paper highlights a dangerous feedback loop. Often, small-scale geographic units (like census tracts) are smaller in high-density urban centers and much larger in rural or outskirts areas. If our models are better at catching spikes in high-density areas and worse at catching silence in low-density/large-scale areas, we inherently bias aid toward wealthier, more connected city centers.
2. MAUP Revalidated
The Modifiable Areal Unit Problem (MAUP) is a classic GIS issue, but this study proves it is a life-or-death factor in crisis informatics. Researchers cannot simply use "available" units like ZIP codes without acknowledging that the size of those units will dictate the results of the damage assessment.
Conclusion & Future Outlook
The study concludes that "big data is not complete data." For social media to be an equitable tool for disaster response, we must adopt scale-aware models.
Limitations: The study is specific to Twitter and Hurricane Harvey. Future work needs to validate if these power law constants hold true for different types of disasters (like wildfires or earthquakes) and different platforms (like Instagram or Waze).
Final Thought: If you are building a crisis response system, remember: Zooming out might show you where the party is, but zooming in shows you where the help is actually needed.