
Geography of Emotion: How Urban Amenities and Mobility Shape Our Happiness
Geography of Emotion: Where in a City are People Happier?
This paper presents a fine-grained spatial analysis of urban happiness by fusing Twitter sentiment data with Foursquare check-ins and US Census demographics. Using Los Angeles as a case study, it confirms that areas with high location-sharing activity correlate with significantly higher positive affect (Valence and Arousal) and increased human mobility.
TL;DR
Is happiness tied to where we live or where we go? This research leverages millions of tweets and Foursquare check-ins in Los Angeles to prove that urban "hotspots"—areas rich in amenities like beaches and restaurants—are significantly happier than average. The study finds a strong correlation between positive sentiment, high human mobility, and specific demographic markers like education and college degrees.
Background: Beyond the Survey
For decades, understanding city-wide happiness meant relying on static, expensive census surveys. In this work, Gallegos et al. position themselves at the intersection of Social Computing and Urban Planning. By using geo-tagged "digital breadcrumbs," they move the field from macro-level national statistics to micro-level census tract analysis.
The "Why": Motivation and Insight
The core hypothesis is that certain places within a city act as "emotional magnets." The researchers intuited that Foursquare check-ins aren't just data points; they are signals of engagement. If people are checking in, the place offers value (amenities). The goal was to see if this physical engagement translates into measurable digital happiness and if this happiness is accessible to everyone.
Methodology: Fusing Sentiment and Space
The authors didn't just look at "happy" words; they used a sophisticated multidimensional approach:
- Sentiment Mapping: Using SentiStrength and the WKB Lexicon, they measured Valence (pleasure), Arousal (activity), and Dominance (power).
- Mobility Quantification: They calculated the Radius of Gyration (rg), a physics-inspired metric representing the standard deviation of distances a user travels from their center of mass.
- Spatial Context: They mapped these scores onto 2012 US Census tracts to account for resident demographics (Age, Education, Ethnicity).
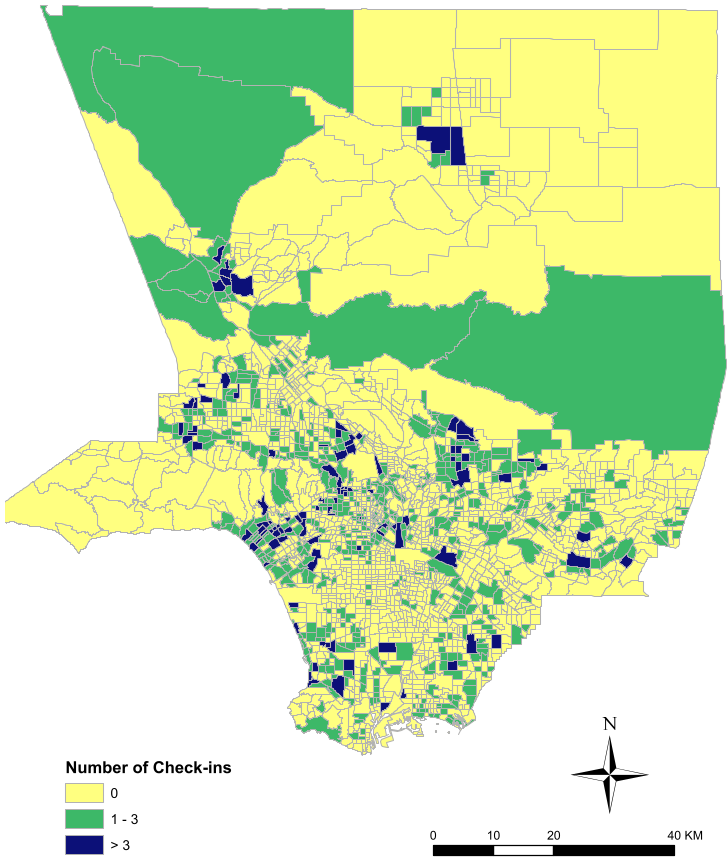 The image shows LA County tracts colored by check-in density, highlighting the uneven distribution of 'active' urban spaces.
Key Results & Critical Evidence
The findings provide a clear "Geography of Emotion":
- Happiness Gap: Tracts with more check-ins (green and blue in Fig 2) showed significantly higher Valence and lower Negative sentiment compared to tracts with zero check-ins.
- The Mobility Paradox: Residents or visitors in these "happy" tracts travel further. The average Radius of Gyration for high check-in tracts was 298.5 km, compared to only 191.9 km for others. This suggests people are willing to commute longer distances for high-quality urban experiences.
- Inequality of Amenities: Word clouds reveal that "happy" tracts are dominated by recreational terms like "beach" and "park," whereas other tracts are defined by generic transit or venue names.
 Note the p-values (**): The increases in Valence and Mobility (Rg) as check-ins increase are statistically robust.*
Critical Analysis & Conclusion
Takeaway
This paper successfully bridges the gap between digital sentiment and physical urban form. It highlights that "happier" urban spaces are currently synonymous with higher education levels and specific demographics, posing a challenge for equitable city planning.
Limitations
A major hurdle in this study—and a recurring theme in the field—is the Resident vs. Visitor problem. Because the data is anonymized, it's hard to tell if the "happy" tweets are from locals who enjoy their neighborhood or tourists who are simply passing through. Furthermore, the "Twitter bias" (younger, more tech-savvy users) means the data might not reflect the elderly or low-income populations accurately.
Future Outlook
The next frontier for this research involves using State Space Models (SSM) or more advanced NLP to track how urban happiness shifts over time (diurnal or seasonal cycles) and how specific policy changes (e.g., building a new park) immediately impact the local "emotional footprint."