Beyond Biometrics: How Data Uncertainty Boosts Obesity Prediction
Effective Integration of Geotagged, Ancilliary Longitudinal Survey Datasets to Improve Adulthood Obesity Predictive Models
The paper introduces AUEDIN, a geospatial data integration framework designed to predict adulthood obesity by merging the NLSY97 longitudinal survey with high-resolution US Census 2000 data. It leverages a weighted aggregation method to handle spatial misalignments and introduces data uncertainty estimates as a first-class feature for machine learning models (ANN, Gradient Boosting, Random Forest).
TL;DR
Predicting obesity is more than just measuring BMI; it's about understanding the environment. Researchers at Colorado State University have developed a framework to integrate massive US Census data with longitudinal youth surveys. By quantifying the uncertainty inherent in merging these datasets and feeding that uncertainty into their AI models, they improved prediction accuracy by over 25%.
The Missing Dimension in Health Analytics
Standard clinical tools, such as the CDC Growth Charts, often fall short because they view a child’s development in a vacuum. A child's BMI velocity can shift due to socio-economic stress, neighborhood food access, or family dynamics.
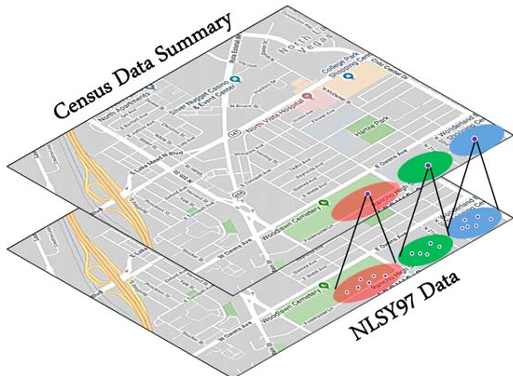
While datasets like the NLSY97 track individuals over decades, they lack environmental context. Conversely, US Census data provides deep environmental insight but doesn't track specific individuals. The challenge? These datasets speak different "geospatial languages"—one uses counties, the other uses tiny city blocks.
Methodology: Turning Noise into Knowledge
The authors' core innovation is AUEDIN (Attribute-based Uncertainty Estimation for Data Integration). Instead of simply averaging Census data to fit a county-level survey, they:
- Weighted Aggregation: Use population density to weight how block-level data influences the county-level estimate.
- Uncertainty Quantification: Calculate the weighted standard deviation for every imported feature. This value represents the "risk" or "reliability" of that specific data point.
Modeling with Risk
Instead of treating integrated data as "ground truth," the researchers used the uncertainty metrics as inputs for Artificial Neural Networks (ANN) and Gradient Boosting. This allows the model to "know" which features are reliable and which are fuzzy approximations.
Experimental Insights
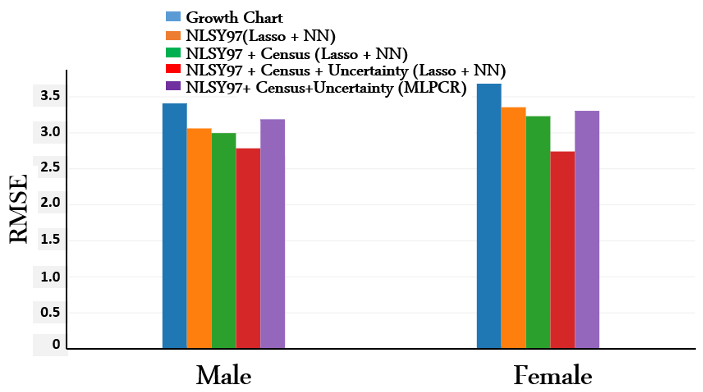
The research utilized a Hadoop-based distributed environment to process 100GB of Census summary files. The team found that as they added layers of data, the Root Mean Square Error (RMSE) dropped significantly.
- Biometrics Only: Highest error.
- + Behavioral/Environmental: Significant drop in error.
- + Uncertainty Estimates: The "Killer Feature." Error reduced by 18.3% (Male) and 25.6% (Female).
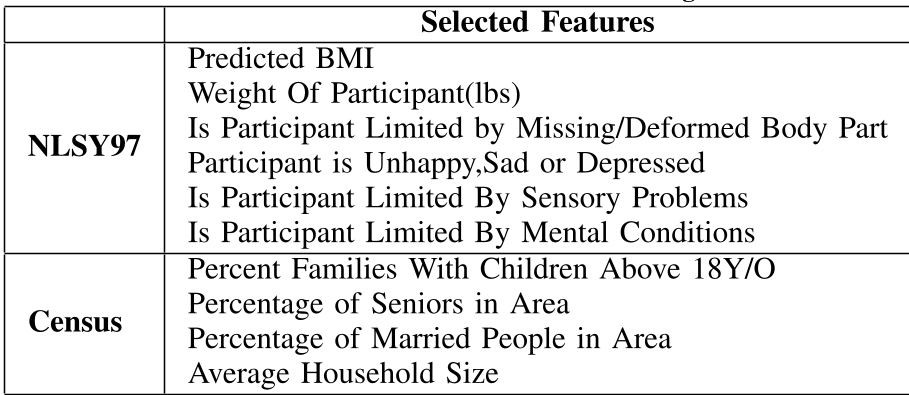 The study reveals that features like "Percentage of Seniors in Area" and "Average Household Size" are powerful predictors when combined with personal biometric data.
Critical Analysis & Conclusion
Why Uncertainty Matters
The most striking takeaway is that uncertainty is a signal. In many ML workflows, researchers try to clean or hide the "noise" of data integration. This paper demonstrates that metadata about data quality provides the model with a higher-order understanding of the feature space.
Limitations
A notable failure in the study was the use of MLPCR (Maximum Likelihood Principal Component Regression). The authors noted it performed worse than simple ANN feature-concatenation because the errors were correlated (spatial blocks within the same county shared similar noise patterns), violating MLPCR's core assumptions.
Future Outlook
This work sets a precedent for Precision Public Health. As we move toward integrating disparate sources—from wearable tech to satellite pollution data—the ability to quantify the "trustworthiness" of every integrated attribute will be the difference between a model that merely tracks the past and one that accurately predicts the future.