
The Alchemy of Sentiment: Decoding Gold Prices through Macroeconomics and Investor Fear
Economics of Gold Price Movement-Forecasting Analysis Using Macro-economic, Investor Fear and Investor Behavior Features
This paper presents a comprehensive forecasting analysis of gold price movements by integrating traditional macroeconomic factors with investor fear indices and behavioral data from Twitter and Google Search Volume Index (SVI). Utilizing Granger Causality Analysis and Expert Model Mining Systems (EMMS), the study achieves a high correlation (up to 0.92 for CPI) and significantly reduces prediction error (MAPE) across short and long-term resolutions.
TL;DR
Predicting gold prices is notoriously difficult because gold lacks "intrinsic" industrial utility compared to other commodities—it is a psychological asset. This paper bridges the gap between traditional economics and behavioral finance by combining Macroeconomic factors (CPI, Forex), Investor Fear (VIX, Stress Index), and Real-time Sentiment (Twitter, Google SVI) to create a robust forecasting framework that outperforms traditional models.
Background: Beyond Interest Rates
In the academic coordinate system, this work moves gold forecasting from a "Fundamental Analysis" niche into the "Behavioral Economics" mainstream. While CPI and USD strength determine the long-term floor for gold, short-term spikes are almost always products of human anxiety and collective search behavior.
1. The Triple-Threat Feature Set
The authors argue that macro-factors are too slow for active trading. To fix this, they categorize features into three resolutions:
- Macroeconomic (Monthly): CPI and Forex (USD vs. EUR, INR, ZAR). CPI showed a staggering 0.924 correlation with gold, confirming its role as an inflation hedge.
- Investor Fear (Weekly): The St. Louis Financial Stress Index and Gold ETF VIX. When the market "freaks out," gold rises.
- Investor Behavior (Weekly/Daily): Twitter "Bullishness" and Google Search Volume Index (SVI).
Methodology Deep Dive: Quantifying "Bullishness"
The authors didn't just count tweets; they used a Naive Bayesian approach to calculate Bullishness () and Agreement ().
This log-scale approach gives more weight to high-volume periods, capturing the "buzz" intensity during market panics.
 Figure 1: The overarching workflow for multi-feature data mining.
2. Causality: Does Twitter Lead Gold?
The study used Granger Causality Analysis (GCA) to prove that these aren't just correlations—they are leading indicators.
- Finding: Google SVI and Twitter "Agreement" show significant causal relationships with gold prices at a 1 to 5-week lag.
- The Intuition: When search terms like "buy gold" spike, the price movement often follows shortly after as retail demand manifests.
3. Forecasting Performance (EMMS & SVM)
The researchers tested an Expert Model Mining System (EMMS)—an optimized ARIMA variant—with and without these behavioral predictors.
| Model Type | With Predictors (MAPE %) | Without Predictors (MAPE %) |
|---|---|---|
| Macroeconomic | 4.00 | 4.04 |
| Investor Fear | 2.16 | 2.32 |
| Investor Behavior | 1.52 | 1.59 |
The result is clear: Investor Sentiment features provide the highest accuracy (lowest MAPE).
Furthermore, using a Support Vector Machine (SVM) with an RBF kernel, the authors were able to predict the direction (Up/Down) of the market with a respectable AUC of 0.63.
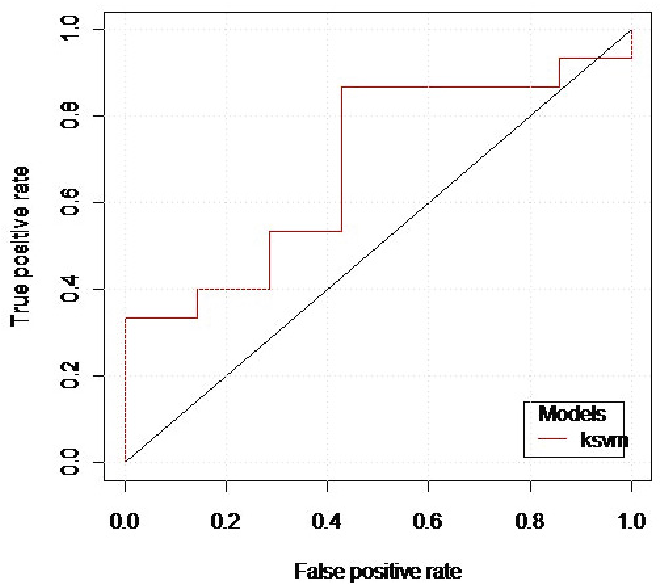 Figure 2: Receiver Operating Characteristics (ROC) showing the trade-off in price direction classification.
4. Academic Insight & Future Outlook
This paper justifies why "Common Sense" factors (like India being the top gold consumer) don't always translate to price movement in USD. The USD/INR forex showed less causality than USD/EUR, proving that gold is primarily governed by global institutional liquidity and Western financial stress rather than just physical consumption.
Limitations: The dataset concludes in 2012. Since then, the rise of algorithmic trading and "meme-stock" style social media dynamics (like r/WallStreetBets) likely makes the Twitter/Sentiment coefficients even more volatile and powerful.
Takeaway: If you want to predict gold, stop looking only at the Fed; start looking at the collective anxiety of the internet.