
From Migration Corridors to Clusters: The Hidden Architecture of Global Mobility
From migration corridors to clusters: The value of Google+ data for migration studies
This paper utilizes "places lived" data from millions of Google+ users to shift the study of international migration from bilateral corridors to triadic "migration clusters." By analyzing sequential residence in three or more countries, the authors identify complex migration systems that traditional demographic sources fail to capture.
TL;DR
For decades, migration has been viewed as a simple A-to-B journey. This paper leverages a massive Google+ dataset of nearly 2 million migrants to prove that migration is actually a clustered phenomenon. By analyzing triadic country groups (A, B, and C), the authors show that migration systems are often moreIntegrated than bilateral flows suggest, especially when influenced by geographic proximity and shared economic ties.
The "Bilateral" Blind Spot
When we look at migration through the lens of a census, we see a snapshot: "Person X moved from India to the UK." If that same person later moves to the US, traditional data often treats these as two disconnected events.
The authors argue that this leads to a "summary of flows" rather than an understanding of a migration system. Why does it matter? Because if we only look at pairs, we miss the "supra-linear" effects where living in a specific pair of countries (like Singapore and the UAE) makes a person far more likely to have also lived in a third (like India).
Methodology: Predicting the "Expected" Cluster
The core of this research lies in distinguishing between expected and observed migration. If country pairs (A,B), (B,C), and (A,C) all have high traffic, we expect the triad (A,B,C) to be frequent.
The authors tested four mathematical models to predict triadic rankings. The winner, Ranking 4, uses a combination of the minimum pairwise frequency (the "bottleneck") and the mean frequency:
Visualizing the Data
The study analyzed over 160 million profiles, eventually narrowing down to nearly 2 million "migrants" (users who lived in at least two countries).
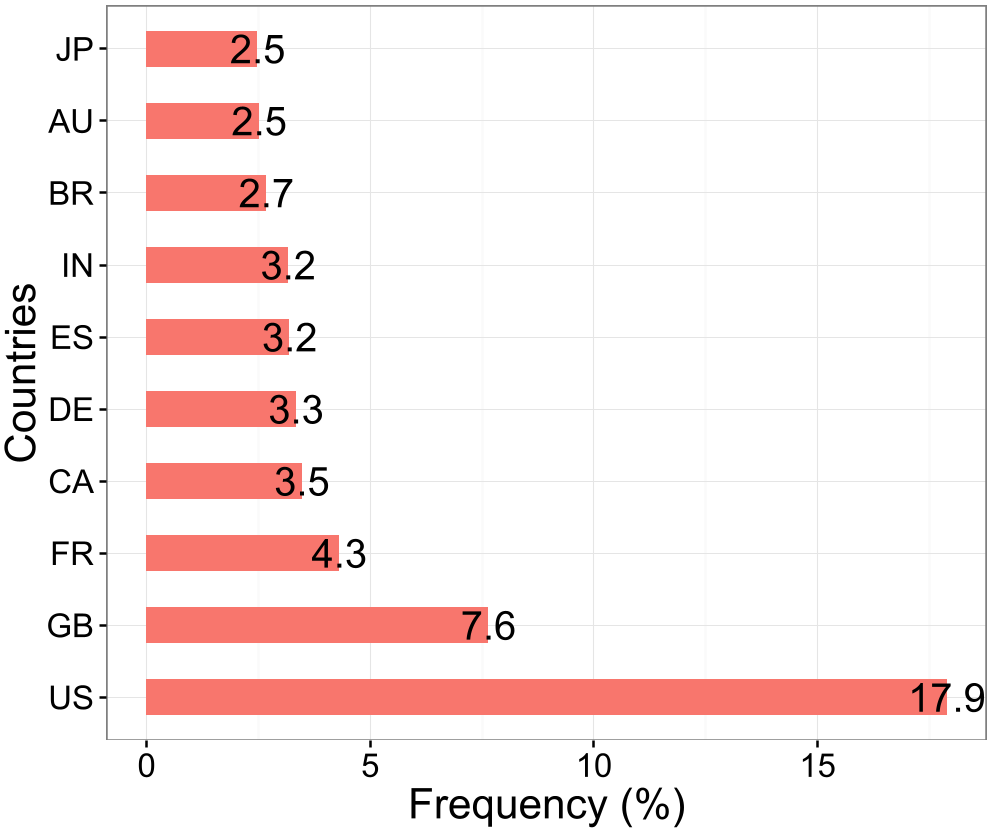 Fig 1: The dominance of US and UK users in the dataset highlights the inherent selection bias of social media platforms.
Key Findings: Why Do Some Clusters Explode?
By comparing the predicted rank to the actual rank, the authors categorized triads into three groups: Higher than Expected, As Expected, and Lower than Expected.
1. The Power of Proximity
Using Information Gain (IG) and Chi-Squared () tests, the researchers found that Geographic Distance and Common Region are the most significant discriminators.
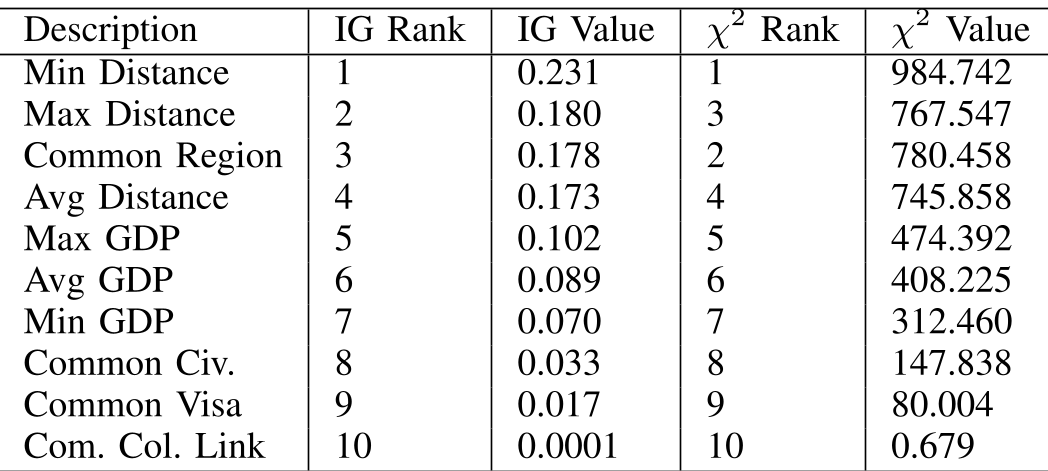 Table 1: Feature selection results showing that distance and GDP outweigh factors like common language or colonial links.
2. Case Studies in Cluster Dynamics
- The Integrated Hub (High-Expected): The triad of Spain-France-Italy ranks much higher than bilateral flows would suggest. This is attributed to European integration, cultural similarity, and short distances.
- The Fragmented Corridors (Low-Expected): Surprisingly, the Brazil-Mexico-US triad ranks significantly lower than expected. While each pairwise connection is strong (high US-Mexico and US-Brazil traffic), the "migration circularity" between all three is low. Individuals move along one corridor but rarely traverse the full cluster.
Critical Insight: Selection Bias and the Digital Divide
A senior editor must note the limitations: The Google+ dataset contains 17.9% US users and is heavily skewed toward a "migrant" population (9% vs. the UN's 3-4% global estimate). Furthermore, the exclusion of China (due to access blocks) creates a massive "dark spot" in the global migration map. However, by using a ranking-based comparison rather than absolute numbers, the authors cleverly mitigate some of these volume-based biases.
Conclusion and Future Outlook
This work marks a transition from "migration as a link" to "migration as a network." The takeaway for researchers is clear: future theories must account for the history of residence.
The potential for this methodology—once applied to more chronological datasets like LinkedIn—could revolutionize how we predict labor market shifts and cultural integration. While Google+ is now a relic of the past, the "places lived" data provided a pioneering template for the future of digital demography.