
Understanding Group Dynamics with GEVi: Visualizing the Lifecycle of Social Communities
Graphical analysis of social group dynamics
This paper introduces GEVi (Group Evolution Visualisation), a visual analytics tool designed to track and analyze the dynamics of overlapping communities in social networks over time. It utilizes the SGCI algorithm and Clique Percolation Method (CPM) to identify group events like birth, merging, and splitting, specifically demonstrating its utility on the Enron email dataset.
TL;DR
Social networks are never static. Humans form, merge, and dissolve groups constantly. This paper presents GEVi (Group Evolution Visualisation), a tool that transforms complex relational data into a readable "evolutionary tree" of groups. By applying this to the infamous Enron email dataset, the authors demonstrate how organizational collapse is reflected in the way people restructure their communication groups months before a crisis hits.
Problem & Motivation: The "Static" Blind Spot
Most social network analysis (SNA) treats communities as snapshots. However, in reality, groups are elusive: a group that exists today might merge with another tomorrow or lose half its members by next week. The complexity grows exponentially when we consider overlapping memberships—where one person belongs to multiple circles simultaneously.
The authors argue that we lack tools that can transition from quantitative stats (how many groups?) to qualitative insights (why did this group split?). They set out to build a system that can "localize" events like birth, death, merging, and splitting within a massive dataset.
Methodology: The Core Engine
GEVi relies on two pillars: Stable Group Changes Identification (SGCI) and the Clique Percolation Method (CPM).
- Extraction: Groups are identified in 30-day "timeslots."
- Tracking: The tool uses a Modified Jaccard Measure to see if a group at Time is "the same" as a group at Time .
- Visualization: To make this readable, they use the Sugiyama Layout, which minimizes crossed lines and keeps the temporal flow (left to right or top to bottom) clear.
The Mathematics of a "Split"
The authors define evolution through specific thresholds. For example, a Split-Merge event is mathematically defined by comparing the group size ratio () and similarity thresholds ():
If the similarity exceeds 0.5, a "transition" arrow is drawn. If one group is ten times larger than the other, it indicates an "addition" or "deletion" (dashed lines).
 Figure 1: Conceptual illustration of group events like birth, death, and merging.
Experimental Analysis: The Enron Case Study
The researchers applied GEVi to 50,572 internal Enron emails. The results were striking:
- Crisis Foreshadowing: Peaks in the number of groups created happened roughly two months before major events, such as when CEO Jeffrey Skilling resigned or the company filed for bankruptcy. Communication became hyper-active right before the collapse.
- The "Trust" Split: During the bankruptcy slots (94-95), a massive group (94_2) suddenly fragmented into several smaller groups.
- Insight: This suggests that as the company failed, broad communication broke down. Employees retreated into smaller, presumably more "trustworthy" subgroups.
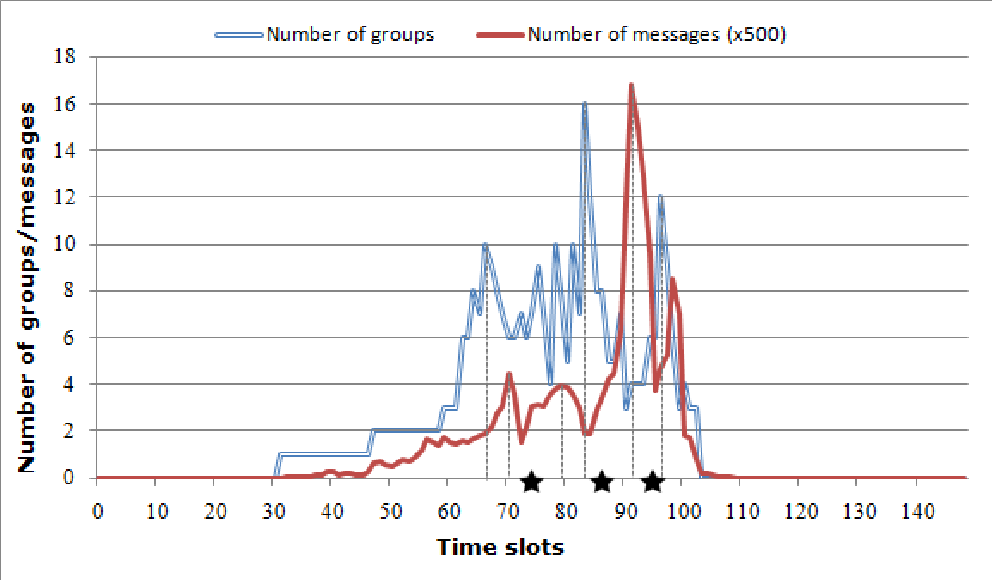 Figure 2: Comparing the volume of messages vs. the number of groups over the Enron timeline. Notice how group peaks precede the stars (key events).
Stability Trends
The tool also tracks Mean Stability. The data shows a gradual decrease in group stability leading up to three months after the bankruptcy. In simple terms, the social fabric of the company was unravelling long after the legal papers were filed.
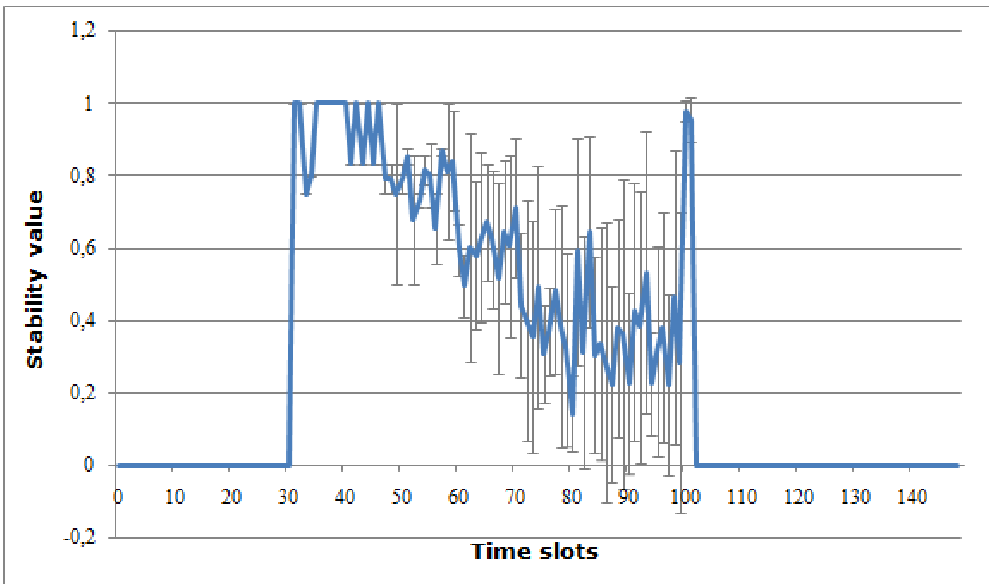 Figure 3: Mean stability and standard deviation over time slots.
Conclusion & Future Outlook
GEVi provides a "macro" view of "micro" interactions. It proves that group dynamics are a leading indicator of organizational health.
Takeaway for Practitioners: In any corporate or social environment, a sudden "shattering" of large groups into small, isolated clusters is often a signal of declining trust or impending structural failure.
Limitations: The tool currently relies heavily on the Clique Percolation Method, which can be computationally expensive for extremely dense datasets. Future work aims to detect even more nuanced event types and scale the visualization for even larger "Real-World" data.