
Decoding the Urban Pulse: Analyzing Group-Level Mobility via Social Media Check-ins
Exploring group-level human mobility from location-based social media check-in data
This paper explores group-level human mobility patterns using over 80,000 Sina Weibo check-in records from Wuhan, China. It identifies four distinct groups (two residential and two student-based) to analyze spatio-temporal dynamics and behavioral differences via community detection and POI-based activity categorization.
TL;DR
By analyzing 86,643 geo-tagged Sina Weibo records in Wuhan, researchers have moved beyond individual tracking to "community-level" mobility analysis. The study finds that while all urban groups are slaves to the "distance-decay" effect, their social identities (students vs. residents) create distinct temporal rhythms and activity preferences that are highly predictable and structurally consistent.
Behind the Scenes: The Motivation
Most mobility research treats the city as a monolith or focuses on individual "random walks." However, we don't live as isolated atoms; we belong to communities—colleges, residential blocks, or professional circles. The authors argue that "Similar social structures direct similar behavior patterns." Understanding these group dynamics is vital for smarter urban planning, targeted epidemic modeling, and more efficient traffic forecasting.
Methodology: From Check-ins to Communities
The researchers tackled the "Identity Problem" by using spatial boundaries as a proxy for social grouping.
- Community Detection: In the "closed" environments of Chinese campuses and residential complexes, check-in frequency acts as a signature. If you check in at China University of Geosciences (CUG) more than anywhere else, you are classified into the CUG community.
- Spatio-Temporal Mapping: The team analyzed "When" (time-of-day and seasonal cycles) and "Where" (travel distance and POI categories) using 12,602 unique users.
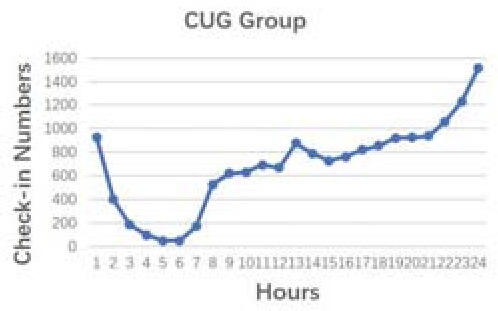 Figure 1: Comparison of daily check-in rhythms between student and resident groups.
Key Insights: The Anatomy of Movement
1. The Temporal Fingerprint
The data reveals a stark contrast in "Night Life." Student groups remain highly active past 10 PM, benefiting from flexible schedules, whereas resident groups see a sharp decline after 7 PM due to standard work cycles. Seasonally, student communities "vanish" during summer and winter breaks, whereas residents provide a stable, cyclical heartbeat for the city's economy.
2. The Tyranny of Distance
Does group identity allow one to escape the physical constraints of the city? The answer is a resounding No. By fitting a Power Law model to travel time versus check-in frequency, the authors found R² values as high as 0.891.
 Table: Statistical parameters for the Power-Law relationship between travel time and activity frequency.
Most activities are concentrated within a two-hour travel circle. Even in the age of digital connection, physical proximity remains the dominant factor in human dynamics.
3. Semantic Activity Profiles
By cross-referencing check-ins with POI (Point of Interest) categories, the study mapped the "soul" of these movements:
- Students: Focused on "Entertainment" and "Outdoor" activities.
- Residents: Prioritize "Living Services" and "Entertainment."
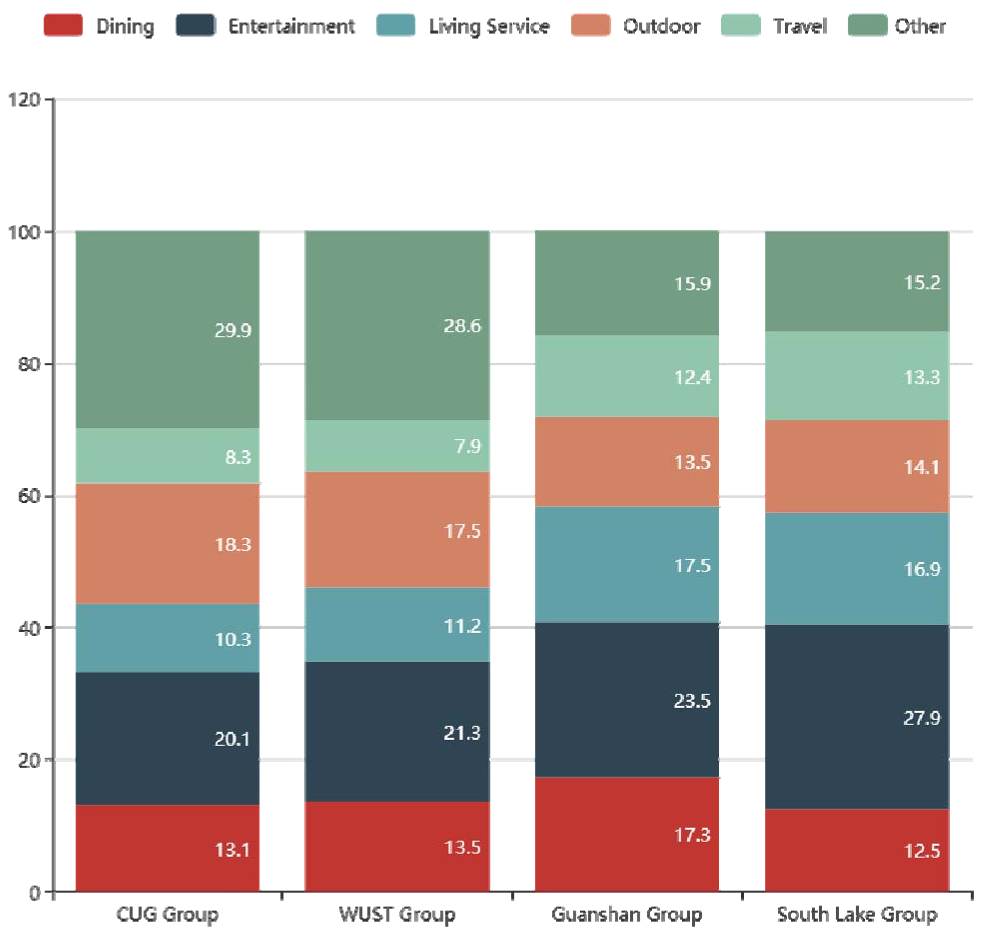 Figure 2: Visualizing the spatial distribution and intensity of POI-based activities across Wuhan.
Critical Analysis & Future Outlook
While the study provides a robust framework for group-level analysis, it relies heavily on spatial classification. In modern "open" cities, the boundaries between work and home are blurring.
The Takeaway: Future research must pivot toward Multimodal AI. As the authors suggest, the next frontier isn't just where a user is, but what they are expressing. By combining check-in coordinates with Natural Language Processing (NLP) of the Weibo text and Computer Vision (CV) of uploaded images, we can unlock a deeper understanding of urban emotions and motivations.
For now, this work proves that our social roles—whether student or salaryman—dictate our urban footprint more than we might like to admit.