
If Walls Could Talk: Decoding the Statistical DNA of Facebook Activity
If walls could talk: Paerns and anomalies in Facebook wallposts
This paper introduces PowerWall, a log-logistic based distribution model designed to characterize Facebook wall activities. By analyzing 2.5 million posts from 7,000 users over three years, the authors demonstrate that diverse interaction metrics follow a heavy-tailed pattern with a near-invariant slope.
TL;DR
Researchers have discovered that your Facebook behavior—how often you post, like, or comment—isn't as random as it seems. By analyzing years of data, they've identified a "universal" statistical distribution called PowerWall. Most human activity follows this pattern with a specific "slope" of roughly 1.0. When someone deviates from this slope, they are almost certainly not behaving like a typical human, but rather like a bot or an automated script.
The Missing Piece in Social Modeling
While the academic world has obsessed over Twitter's "firehose" and Facebook's "friendship graphs," the actual User Wall—the digital living room where interactions happen—has remained a "black box."
The problem with using standard tools like Power Laws is that they assume the "rich get richer" immediately. However, human behavior has a "startup cost." On a log-log plot, real data shows a flatness at the beginning (low activity) before dropping off into a heavy tail. Standard distributions like Pareto or Lognormal simply can't capture this nuance accurately.
Introducing PowerWall: The Odds Ratio Insight
The core methodology of this work shifts the focus from simple Probability Density Functions (PDF) to the Odds Ratio function.
For a PowerWall distribution, the Odds Ratio is defined as:
When you plot this on a log-log scale, it transforms into a beautiful straight line. The researchers found that for almost every feature—from the number of "Self Likes" to "Photo Posts"—the slope () of this line was remarkably stable between 0.9 and 1.2.
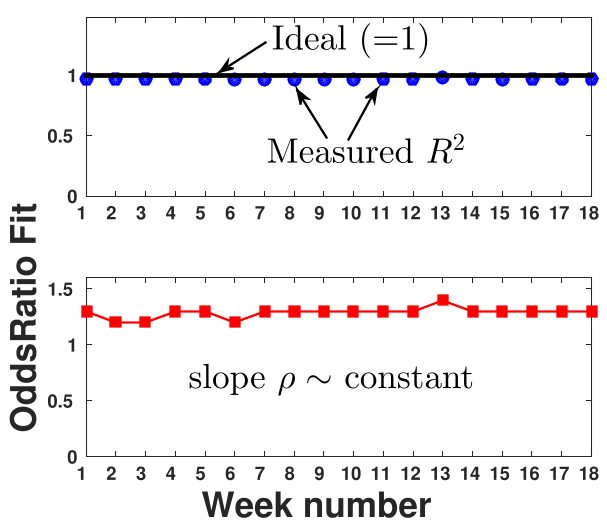 Figure 1: The PowerWall fits real data persistently. Even when broken down by weeks, the slope remains a near-invariant constant.
A Universal Signature Across Time
One of the most profound findings is the pervasiveness of this model. The team analyzed three separate datasets (2011, 2012, and 2013). Despite shifting social trends and changes to the Facebook UI, the "PowerWall" held firm.
- Accuracy: Consistently above 0.95.
- Slope Stability: The value of stayed within 8% of its mean across three years.
- Special Case: The paper mathematically proves that while PowerWall generalizes human behavior, it includes the famous Pareto distribution as a terminal case when the location parameter is small.
Spotting the "Cyborgs" and "Insomniacs"
The real power of a mathematical law is its ability to define "normal." By identifying users who failed to fit the PowerWall line, the authors discovered fascinating anomalies:
- The Flip-Flopper: A user whose posting frequency oscillated perfectly between 0 and 25 posts. Investigation revealed the use of dlvr.it, an automation app.
- The Night Owl: A user who posted exclusively at one specific hour of the night with zero activity elsewhere—a clear signature of a scheduled script via a Twitter-to-Facebook cross-poster.
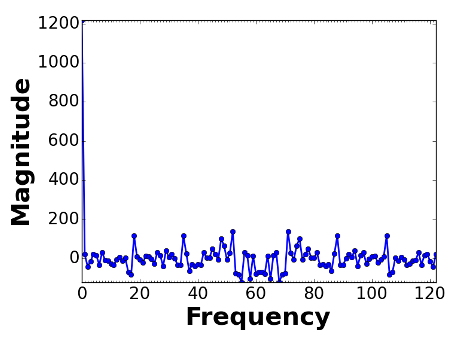 Figure 2: Comparing a 'Typical User' to outliers. Typical users show organic gaps (sleep patterns), while outliers display rigid, periodic spikes typical of automation.
Conclusion: Human-Centric Profiling
This research moves us closer to a systematic, quantitative way to profile social media activity. The PowerWall isn't just a curve-fitting exercise; it is a baseline for human digital ecology.
Key Takeaways:
- Uniformity: Human social interaction is governed by heavy-tailed dynamics that are more stable than we might expect.
- Security Utility: Models like PowerWall are essential for platform integrity, allowing developers to spot "non-organic" accounts through statistical deviation rather than just keyword tracking.
- Future Work: Could this slope () be a fundamental constant of human attention span in digital spaces? The stability across three years suggests there is a deeper psychological limit at play.
Original code for this study is available on the authors' GitHub.