
Decoding the Digital Fingerprints: Image Provenance via Social Network Traces
16549_Image Origin Classification Based on Social Network Provenance.
This paper introduces a forensic methodology to identify the social network (SN) origin of digital images and estimate their original JPEG quality factor (QF). By analyzing characteristic traces left by platform-specific compression in the DCT domain and employing a Random Forest classifier, the authors distinguish between Facebook, Twitter, and Flickr with high accuracy.
TL;DR
In the era of viral misinformation, knowing where an image came from is as important as the image itself. This paper presents a forensic technique that identifies whether an image was downloaded from Facebook, Twitter, or Flickr by analyzing the subtle distortions introduced by their proprietary compression algorithms. Using DCT coefficient histograms and Random Forests, the authors achieve over 88% accuracy even on uncontrolled, real-world web images.
The Problem: The "Black Box" of Social Media
When you upload a high-quality photo to Facebook or Twitter, the platform doesn't just store the file; it processes it. It resizes, recompresses, and often strips all metadata (EXIF) to save space and protect privacy. For forensic investigators, this creates a "black box" effect. Traditional tools used to identify the camera model or detect tampering often fail because the social network's own processing masks the original forensic traces.
The authors argue that this "masking" is actually a signature. Every platform uses a different set of parameters—quantization tables, interpolation methods, and subsampling—leaving a unique statistical fingerprint on the pixels.
Methodology: The Geometry of DCT Histograms
The researchers focused on the Discrete Cosine Transform (DCT) domain. Since almost all social networks use JPEG compression, the "echoes" of their processing are most visible in the DCT coefficients of 8x8 pixel blocks.
1. Feature Extraction
The method extracts histograms for the first 9 DCT modes (excluding DC) in a zig-zag order.
- Insight: Even if two platforms aim for the same "Quality Factor," their internal rounding and filtering strategies differ.
- Vectorization: By binning these values (between ±20), they create a 369-element feature vector () that serves as the image's digital "provenance signature."
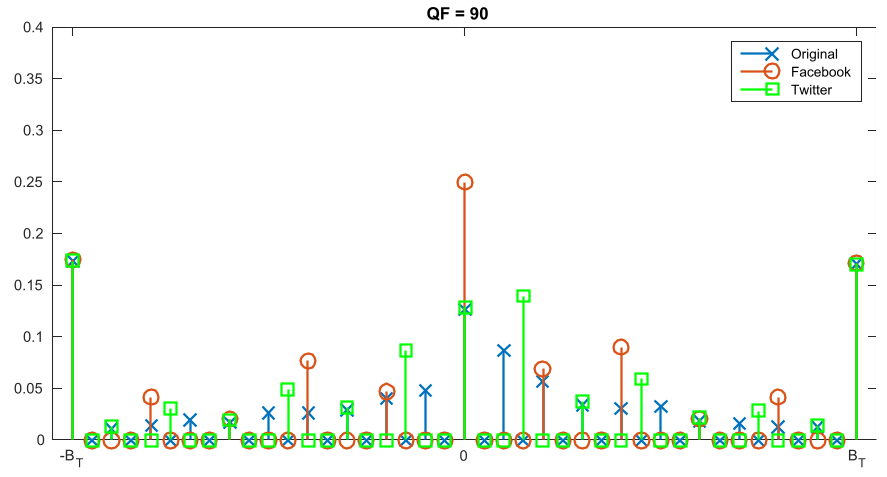 Fig 1: Notice the distinct shifts in magnitude and position between original (blue) and Facebook-processed (red) DCT coefficients.
2. Classification
The team utilized a Bagged Tree Random Forest. This ensemble approach is particularly effective here because the relationship between compression traces and platform identity is non-linear and multidimensional.
Experiments and Results
The study used the UCID (Uncompressed Colour Image Database) to create a controlled environment, generating 30,000 images with varying initial Quality Factors (QF 50 to 95).
Key Findings:
- High Precision: Facebook and Twitter were identified with nearly perfect accuracy in controlled tests.
- The Twitter "Passthrough" Quirk: The study discovered that Twitter often does not process images if the original QF is , leading to some confusion with uncompressed images in that specific range.
- Flickr's Quality Standard: Images from Flickr consistently appeared to have been normalized to a QF of roughly 90, making original QF detection harder but platform identification easier.
 Table 1: Classification results identifying the specific SN origin among Facebook, Twitter, and Flickr.
Real-World Validation: The "Open Scenario"
To test the method's robustness, the authors downloaded 3,000 "uncontrolled" images from the public web (using keywords like "whales" or "Steve Jobs"). Even without knowing the images' histories, the classifier achieved an 88.75% success rate. This significantly outperformed traditional double-compression detection features (like those proposed by Pevný & Fridrich), which averaged around 73-78% on the same data.
Critical Insight: Why This Matters
This work shifts the focus of image forensics from "What was the camera?" to "What was the journey?" By proving that social networks leave identifiable traces, it enables Image Phylogeny Reconstruction. If an investigator finds a suspicious image, they can now determine if it has passed through Facebook or Flickr, potentially leading them to the original account or source of the upload.
Limitations & Future Work
The primary limitation is the rapid evolution of platform algorithms. If Facebook updates its compression engine tomorrow, the classifier may need retraining. Future research aims to expand to platforms like WhatsApp, Google+, and Instagram, while also exploring Deep Learning architectures to "learn" these fingerprints automatically without manual DCT binned features.
Conclusion
Social networks are not just passive hosts; they are active signal processors. By treating the artifacts of these platforms as forensic evidence rather than noise, we gain a powerful new tool in the fight against digital deception and the reconstruction of multimedia history.