
Decoding the Estonian Social Fabric: How Nature and Sports Shape Our Calls
Impact of Natural and Social Events on Mobile Call Data Records – An Estonian Case Study
This study investigates human behavior in Estonia by analyzing an anonymized Call Data Record (CDR) dataset from a major mobile operator. Using Social Network Analysis (SNA) and temporal modeling, it identifies structural patterns in the national calling network and quantifies how natural phenomena and social events shift communication activity.
TL;DR
By analyzing a massive anonymized CDR dataset from Estonia, researchers have mapped the nation's "communication pulse." The study reveals a sparse, fragmented social network where calling patterns are significantly influenced by the day of the week, the temperature, the phase of the moon, and even the "lulls" in a football match.
Background Positioning
In the hierarchy of "Big Data" research, Call Data Records (CDR) remain a goldmine for understanding human dynamics. This paper functions as a Socio-Cultural Case Study, moving beyond simple mobility tracking to explore how external "shocks"—both natural and social—alter the way a population communicates. It places Estonia on the map of digital phenotyping, providing a baseline for behavioral patterns in a highly digitized society.
Problem & Motivation: Why CDR?
Traditional surveys are slow and often biased. CDR, however, offers a passive, non-intrusive lens into collective behavior. The authors noticed that while we know people move differently during events, we don't fully understand if they talk differently. Is a "full moon" effect real in telecommunications? Does the cold silent the phones as well as the streets? These are the questions driving this research.
Methodology: The Core Architecture
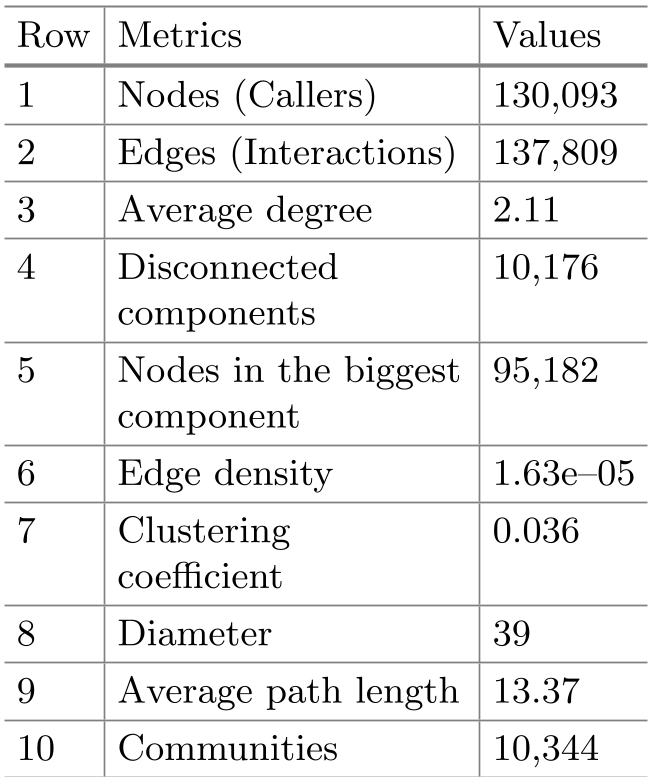
The researchers treated 722,724 calls as a massive graph. Nodes are callers; edges are conversations.
1. Social Network Analysis (SNA)
By stripping the data down to its mathematical skeleton, they found a Scale-Free yet Sparse network. With an average degree of just 2.11, the average Estonian caller interacts closely with only two others in a month, suggesting that mobile calling is a tool for "strong ties" rather than broad social browsing.
2. Geographical and Temporal Flows
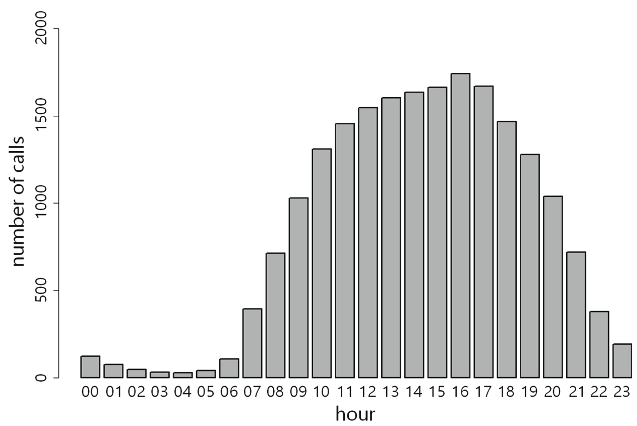
The study mapped inter-county connections, revealing that Harju (the capital region) acts as the central hub. A fascinating discovery was the strong link between Harju and Ida-Viru, likely driven by the shared Russian-speaking communities in both regions—proving that CDR reflects ethnic and cultural geography.
Impact of Events: The Findings
The most compelling part of the study is how "externalities" modulate the call volume:
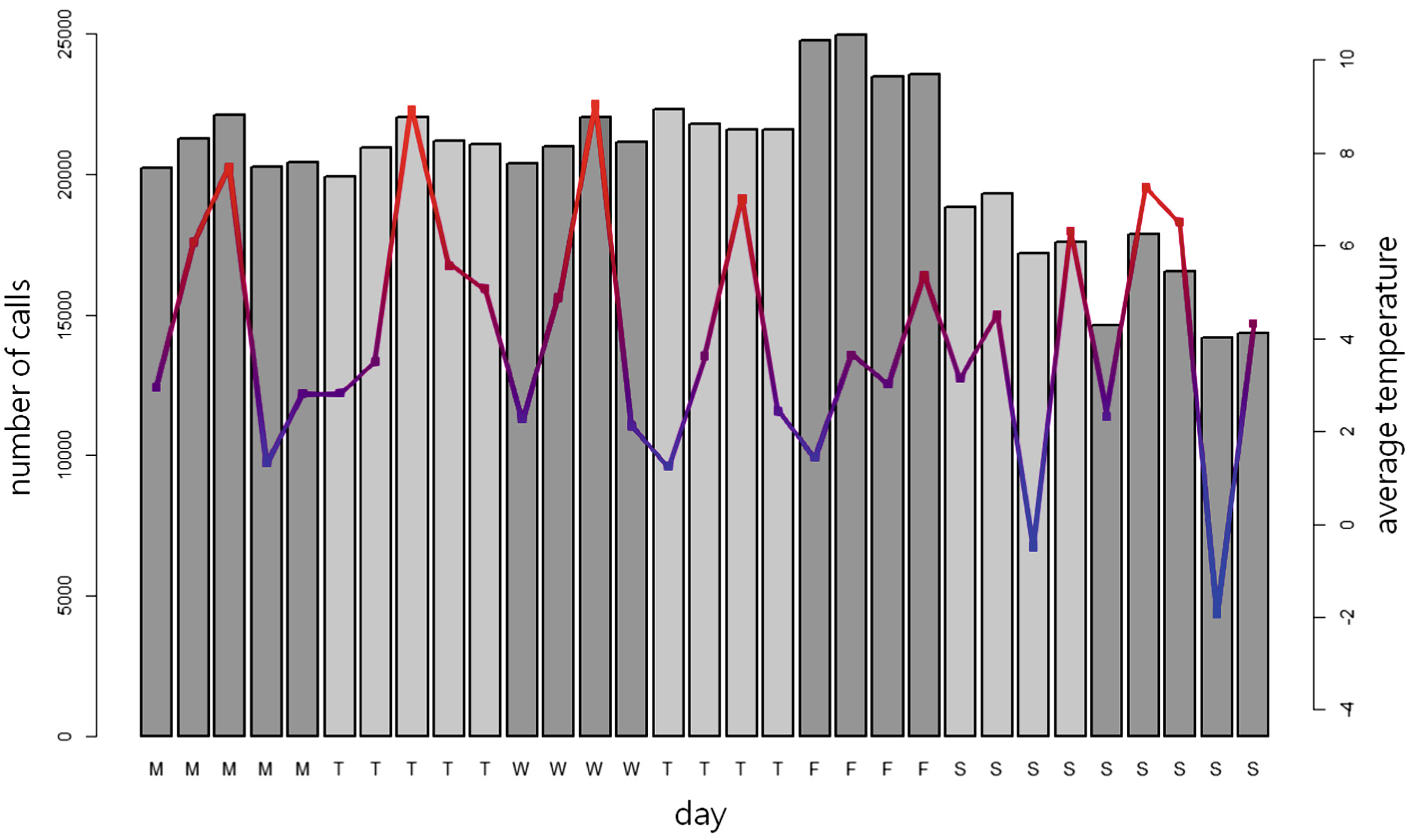
- The Friday Peak: Friday is the most active day (+19.27% above avg), as people coordinate weekend plans.
- The Temperature Effect: The coldest day of the month was also the quietest. When temperatures dropped to -1.94°C, call activity fell 8.6% below the average for that day type. Cold weather effectively "freezes" social coordination.
- The Lunar Influence: During the "Micromoon" of March 2015, nightly activity increased by nearly 6%. This suggests a subtle but measurable "lunar effect" on human social arousal or late-night activity.
- Social Sychronization: During an Estonia-Iceland football match, stadium-area calls were 2.86x higher than average. However, 73% of these calls happened before or after the match. During the game, fans were too engrossed to talk on the phone—a clear sign of "collective attention."
Critical Analysis & Conclusion
This work demonstrates that CDR is more than just billing data; it is a Societal Sensor.
Takeaway: The study proves that call activity is a reflection of physical reality. If we see a sudden drop in calls in a specific region, it might not just be a network failure—it might be a snowstorm or a high-stakes local event.
Limitations: The dataset only represents 10% of one operator's users over a single month. To truly establish the "Lunar Effect" or "Temperature Correlation," multi-year data would be required to strip away seasonal noise.
Future Work: The authors suggest integrating financial (bank) data with CDR to see if "how we talk" correlates with "how we spend." This multi-layered approach could lead to highly accurate socio-economic predictors for urban planning and crisis management.