
Bus Stop CSI: Navigating the Invisible Cities through Crowdsourced Street View
Improving Public Transit Accessibility for Blind Riders by Crowdsourcing Bus Stop Landmark Locations with Google Street View: An Extended Analysis
The paper introduces "Bus Stop CSI," a scalable crowdsourcing method that combines Amazon Mechanical Turk (MTurk) and Google Street View (GSV) to collect detailed landmark descriptions (e.g., benches, shelters) for bus stops. The system aims to assist blind and low-vision riders in the difficult task of locating and verifying unfamiliar transit stops.
TL;DR
Locating a bus stop is a major accessibility barrier for blind riders. This paper presents a scalable solution by leveraging Google Street View (GSV) and Amazon Mechanical Turk to "map" the landmarks (benches, trash cans, poles) surrounding bus stops. With a median accuracy of over 87%, this virtual audit method proves that we can generate high-quality accessibility metadata without ever setting foot on the street.
Problem & Motivation: The "Last Meters" Challenge
For a sighted person, a bus stop is easily spotted by a sign or a shelter. For a blind or low-vision rider, finding the exact pole or bench in an unfamiliar neighborhood is a stressful and time-consuming challenge. Current trip planners tell you where the stop is geographically, but not what it feels or looks like from a pedestrian perspective.
Previous attempts relied on in situ crowdsourcing—asking users to log data while waiting for the bus. This approach suffers from "cold start" problems: low data density in suburban areas and high cognitive load on the very users who need the help. The authors' insight: Use the eyes of the crowd and the memory of the internet (GSV) to do the work remotely.
Methodology: The Virtual Auditor
The authors developed Bus Stop CSI (Crowdsourcing Streetview Inspections). The system doesn't just show static images; it provides a restricted interactive environment where workers can pan, zoom, and take limited "steps" to find landmarks within a defined 20ft perimeter.
1. Training the Crowd
To ensure quality, workers had to pass a four-stage interactive tutorial (Tutorial 1-4) specific to the city's bus stop designs (e.g., DC vs. Seattle).
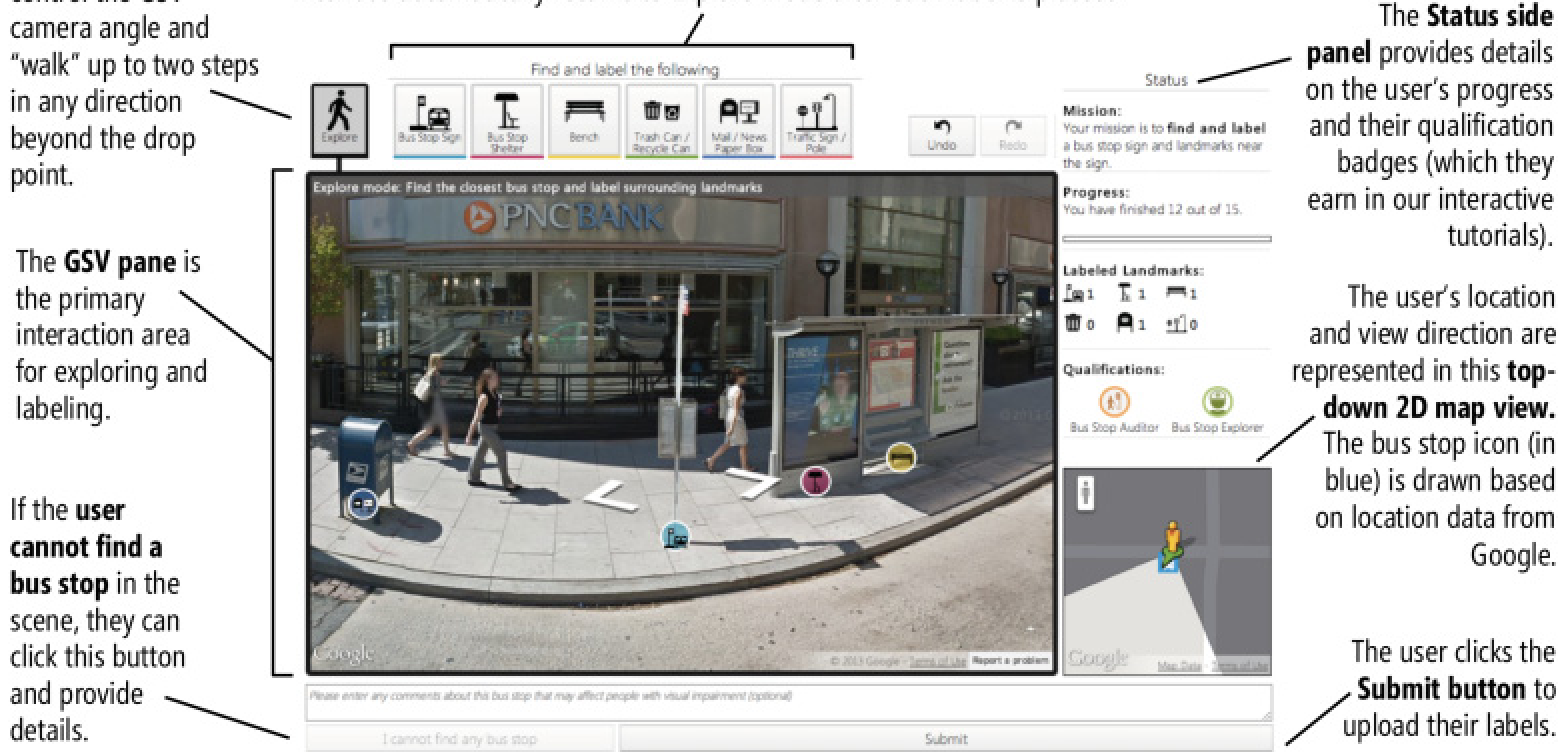 Figure 1: The Bus Stop CSI interface featuring the interactive GSV pane (top) and labeling controls (bottom).
2. Validating the Dataset
Before trusting the crowd, the researchers conducted a comparative study (Study 2) to see if GSV data is actually "real." They physically audited 179 stops and compared the logs with GSV audits. The result? A high Spearman correlation (ρ = 0.88 for shelters and benches), proving that despite image age (avg. 1.75 years), GSV is a viable digital twin for accessibility auditing.
Experiments & Results: Evaluating the Human-in-the-Loop
In a study with 153 MTurk workers labeling 150 stops, the system achieved impressive results:
- Baseline Accuracy: 82.5% for individual workers.
- Majority Vote (N=7): 87.3% accuracy.
- Salience Matters: Highly salient landmarks like shelters (88.6%) and mailboxes (88.8%) were easier to find than open-ended categories like "Traffic Signs/Other Poles" (66.2%).
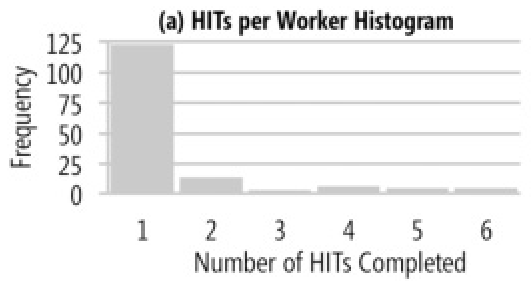 Figure 2: Analysis of labeling time (avg 44.7s) and the impact of majority voting on accuracy.
Why do errors occur?
The authors identified that false negatives (underlabeling) were the dominant error type. This was often caused by:
- Occlusion: Parked buses or trees blocking the view.
- Distance: Some bus stops were on the far side of wide avenues.
- Ambiguity: Difficulty in judging if a landmark was truly within the 20ft boundary.
Deep Insight & Future Outlook
This work highlights a shift in Accessibility Research from Assistsive Tools to Information Infrastructure. By generating detailed metadata through crowdsourcing, we create a layer of "digital braille" for the physical world.
Takeaways:
- Scalability: Remote auditing is vastly more efficient than field work.
- Hybrid Intelligence: While AI could eventually detect these poles, the human ability to navigate complex, shadowed, or blurred GSV scenes currently provides the high precision required for accessibility applications.
- Limitations: The reliance on Google’s API means that if Google doesn't know a stop exists, neither does the tool. Future iterations should allow workers to "discover" stops by sweeping neighborhoods.
Final Thought: The success of "Bus Stop CSI" suggests a future where our digital maps aren't just for cars and commerce, but are enriched with the tactile and sensory landmarks essential for inclusive urban mobility.