
Beyond Popularity: Discovering Influential Areas via User Social Prestige
Discovering Influential Areas According to Check-In Records and User Influence in Social Networks
This paper proposes a framework to identify "Influential Areas" in Location-Based Social Networks (LBSNs) by integrating spatial check-in data with social graph theory. It utilizes Eigenvector Centrality for user influence calculation and the DBSCAN algorithm to cluster geolocated check-ins, introducing the Accumulated Influence Index (AII) to rank spatial clusters.
TL;DR
Quantifying the "influence" of a geographical area has traditionally been a game of numbers—counting check-ins or pings. This paper argues that this approach is flawed because it ignores the Social Influence of the visitors. By combining Eigenvector Centrality (to measure "who" is important) and DBSCAN (to cluster "where" they go), the authors introduce the Accumulated Influence Index (AII) to identify areas that might have lower traffic but higher social amplification potential.
Problem & Motivation: The "Elite" Visitor Effect
Why do we care about influential areas? For advertisers and urban planners, a check-in by a social media "influencer" is worth significantly more than a check-in by an isolated user. Current SOTA methods often fall into two traps:
- Social Blindness: Treating all GPS pings as equal.
- Structural Limitations: Using K-means clustering which forces circular shapes and fails to handle "noise" in sparse urban data.
The authors' insight is simple: An area’s social value is the sum of its visitors' social capital.
Methodology: Graph Theory Meets Geospatial Clustering
1. Measuring User Influence (The "Who")
The paper compares various centrality measures:
- Degree Centrality: Too local; ignores the quality of connections.
- Betweenness/Closeness: Focuses on topological flow, not social "prestige."
- Eigenvector Centrality: Chosen because it acknowledges that "being friends with a celebrity makes you more influential." It characterizes the global prominence of a node.
2. Spatial Clustering with DBSCAN (The "Where")
Standard K-means fails in geography because cities aren't made of perfect circles. The authors use DBSCAN, which identifies clusters based on density and can find concave, linear, or complex shapes while ignoring outliers (noise).
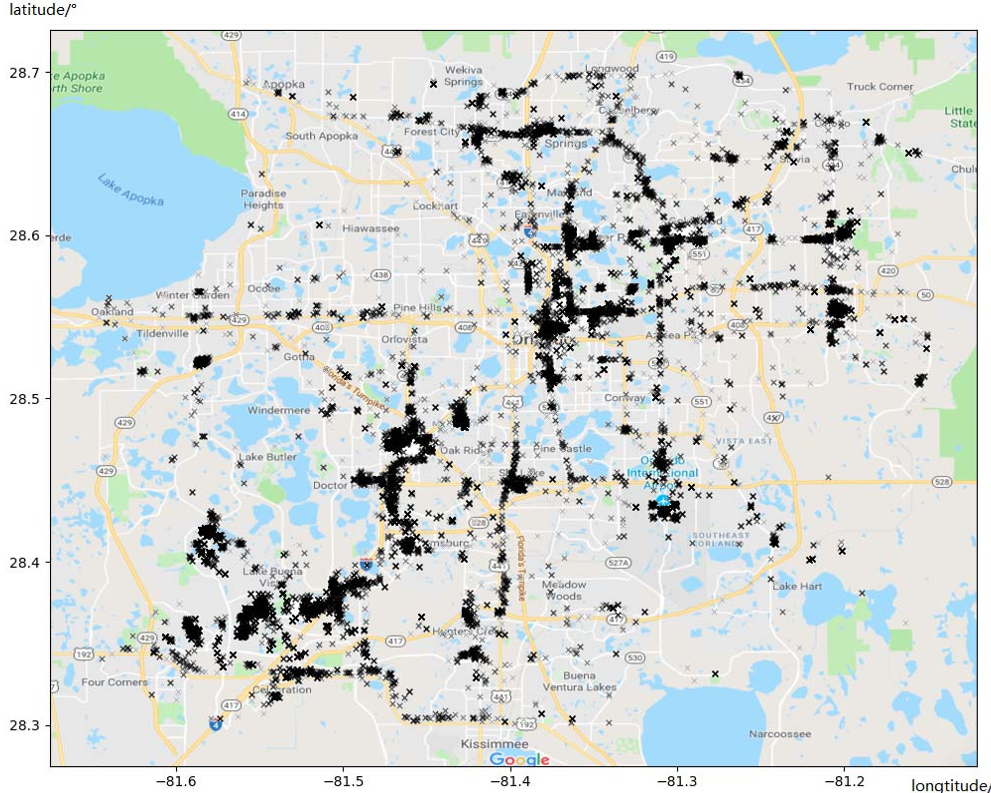 Figure 1: Scatter diagram of Orlando check-in points showing the raw spatial data before clustering.
3. The Combined Metric: AII
The Accumulated Influence Index (AII) for a cluster is the sum of the Eigenvector Centralities of all users who checked in there.
Experiments & Results: Quality Over Quantity
Using the Gowalla dataset (6.4M check-ins), specifically focusing on Orlando, FL, the authors demonstrated a critical disconnect between raw popularity and influence.
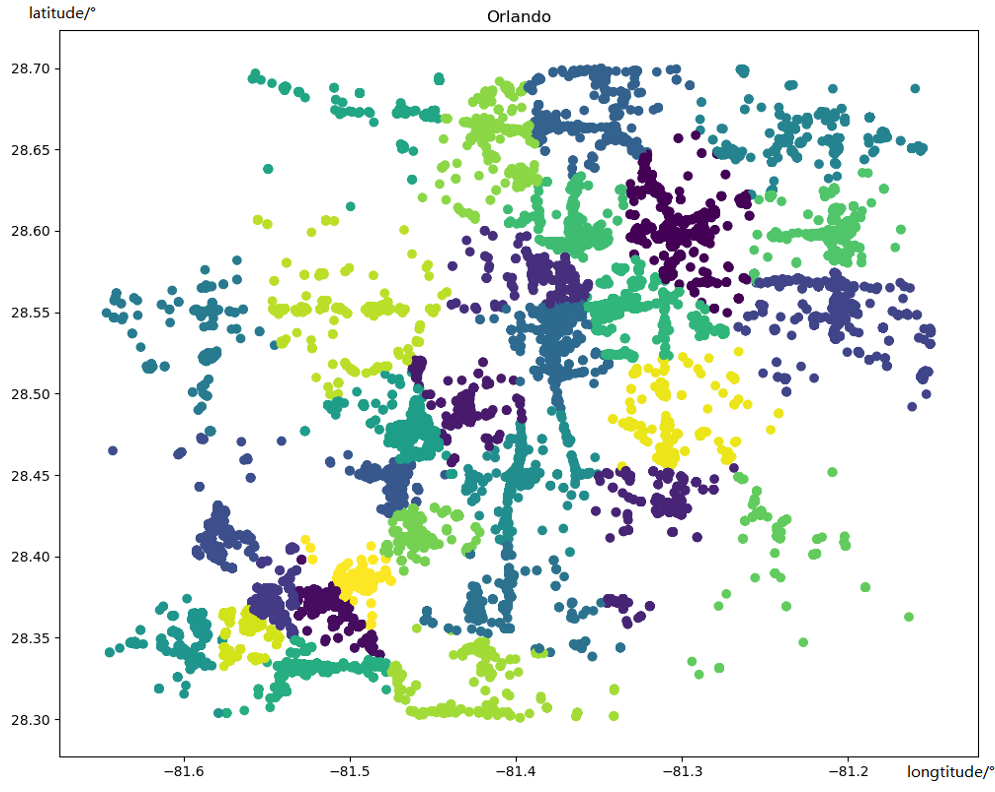 Figure 2: K-means (shown here) forces every point into a cluster, whereas DBSCAN correctly identifies high-density "influential" hubs while discarding noise.
Key Findings:
- The Disconnect: Cluster 11 had fewer check-ins than Cluster 2 but a comparable AII. This suggests Cluster 11 is a "high-leverage" area visited by more influential people.
- Validation: Top-ranked areas included Disney World and Universal Studios, but also specific shopping centers (IKEA/Target) that showed high AII, revealing their potential for targeted advertising.
| Rank | Cluster ID | AII (Influence) | Total Check-ins |
|---|---|---|---|
| 1 | 3 (Disney) | 44.86 | 7428 |
| 6 | 11 (Mall) | 7.67 | 2073 |
| 7 | 0 (Airport) | 6.04 | 2956 |
Note: Cluster 11 has fewer check-ins than Cluster 0 but higher AII, proving it is socially "louder".
Critical Analysis & Conclusion
Takeaway
This work shifts the focus from Volume to Value. By identifying areas where "nodes of high centrality" congregate, businesses can optimize site selection and digital ad bidding where the "word-of-mouth" potential is highest.
Limitations
- Temporal Dynamics: The model assumes influence is static. In reality, an area might be influential during a convention but "dead" the week after.
- Parameter Sensitivity: DBSCAN is highly sensitive to the
Eps(radius) andMinPts. The paper used a trial-and-error approach; future work should automate this sensitivity analysis.
Future Outlook
Integrating Temporal Analysis (Time-of-day influence) and User Activity Levels (how often an influencer actually posts) would turn this into a real-time engine for "Urban Trend Prediction." This is a foundational step toward a more "Socially-Aware" GIS (Geographic Information System).