
Information Design: Bridging the Gap Between Biological Complexity and Human Intuition
Information Design of Biological Networks: Application to Genetic, Immunologic, Metabolic and Social Networks
This paper introduces "Information Design" as a new framework to visualize and analyze complex biological networks (genetic, immunologic, metabolic, and social). It utilizes the Sophosware Graph Library to provide hierarchical 3D representations and Markovian state dynamics to facilitate comprehension for patients, physicians, and researchers.
TL;DR
Modern biology is drowning in data but starving for clarity. This paper presents a pioneering framework called Information Design, aimed at converting complex biological networks—ranging from protein complexes to social contagion models—into intuitive, hierarchical 3D visualizations. By integrating Markovian dynamics and the Sophosware Graph Library, the authors provide a roadmap for visualizing not just "who interacts with whom," but the functional "how and when" of living systems.
The "Hairball" Problem: Why Traditional Graphs Fail
In bioinformatics, we often encounter interaction graphs that resemble a tangled "hairball." While these graphs are mathematically complete, they are functionally opaque.
- Lack of Hierarchy: They don't distinguish between a simple link and a core regulatory circuit (Strongly Connected Components).
- Static Nature: They fail to show how a system moves from an initial state to a stable "attractor" (e.g., a healthy cell vs. a cancerous cell).
- Generic Visualization: They ignore the "anatomy" of the system, treating a gene, a metabolite, and a human in a social network as identical nodes.
Methodology: The Core of Information Design
The authors tackle these issues through four distinct pillars, with a focus on hierarchical representation and state dynamics.
1. Hierarchical Decomposition
Instead of a flat graph, the system uses Macro-nodes. A macro-node can represent a functional sub-network (like the cell cycle control). This allows a user to "zoom" from the global network view into specific local regulatory architectures without losing context.
2. Markovian Stochastic Dynamics
To move beyond static images, the paper employs a Stochastic Hopfield Rule. This allows for the simulation of the probability of gene expression over time.
- Transient Behavior: How the system reacts immediately after a stimulus.
- Asymptotic Behavior: The final steady state or "attractor" the system settles into.
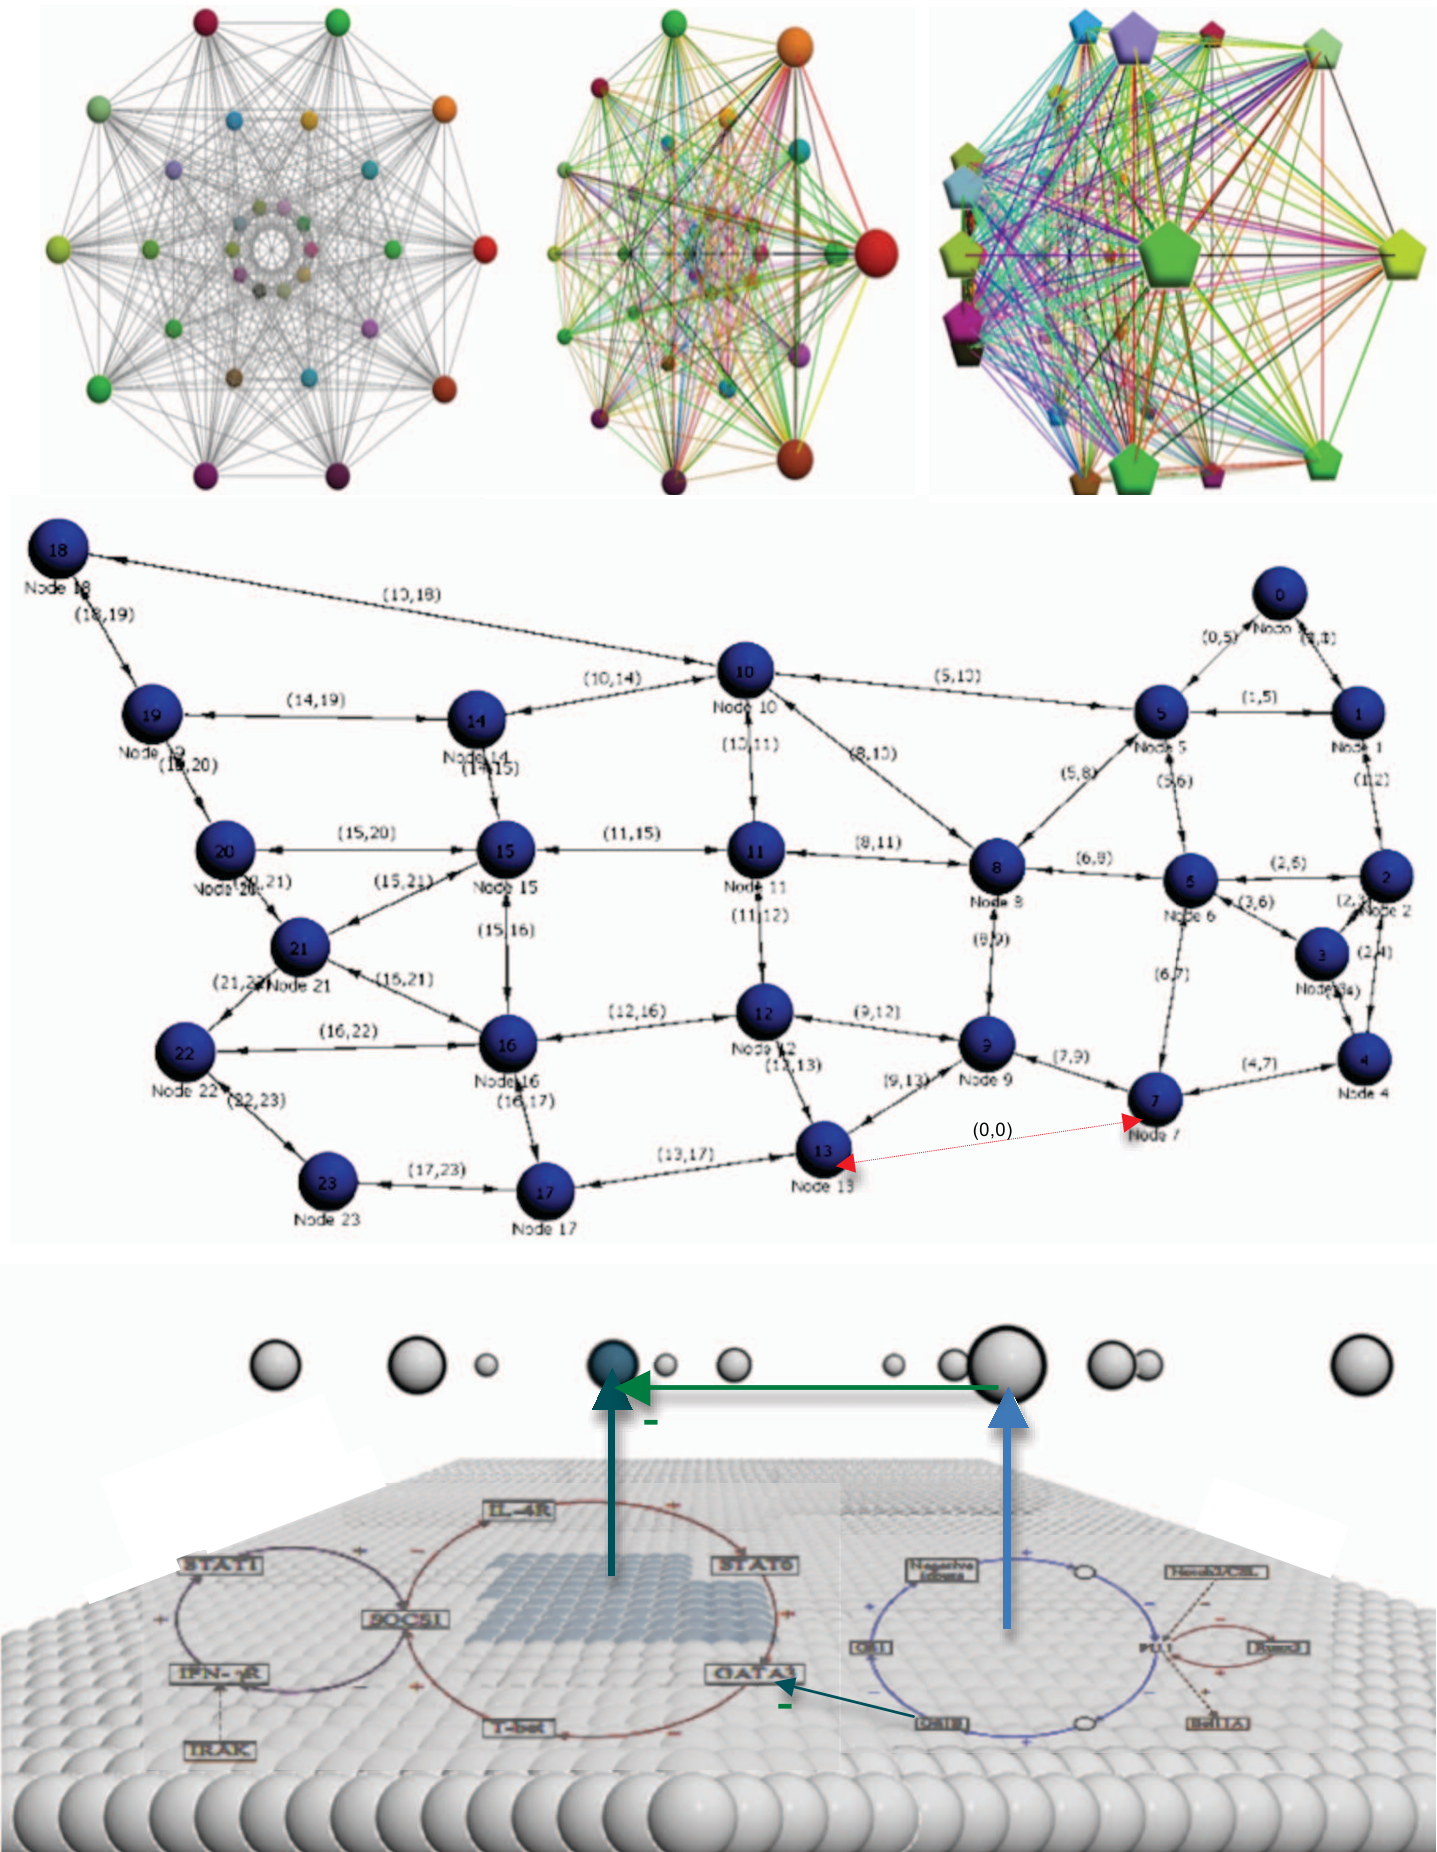 The image above demonstrates the 3D visualization of interaction graphs, where weighting and macro-node clustering provide a clear view of the internal hierarchy.
Case Studies: From Genes to Obesity
The paper applies this framework across four diverse domains:
- Genetic Networks: Visualizing the regulation of S. cerevisiæ and the cell cycle.
- Immunetworks: Mapping the control of T-Cell Receptors (TCR) and the role of microRNAs in stabilizing immune cell differentiation.
- Metabolic Pathways: Modeling the glycolysis pathway in neurons and astrocytes.
- Social Networks: Treating obesity as a "contagious social disease" by modeling the flow between healthy, overweight, and obese populations.
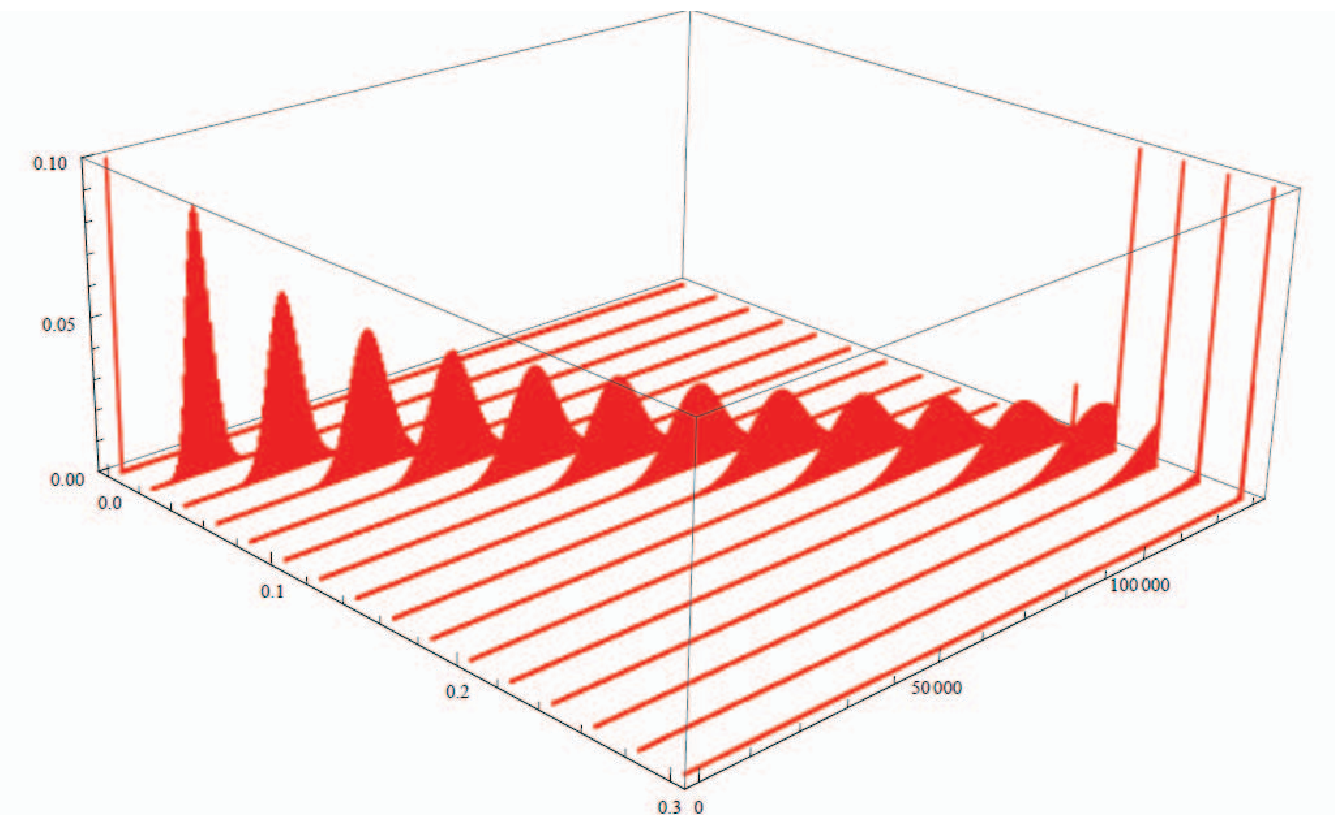 This 3D plot visualizes the evolution of a Markov chain across over 130,000 states, showing the transition from an initial state toward a final stable attractor.
Critical Insights & Future Outlook
The true value of this work lies in its end-user focus. By leveraging OpenGL for 3D navigation (using mouse or joystick), it moves biological modeling out of the ivory tower and into the hands of clinicians and educators.
Limitations & Challenges:
- The 4D Challenge: While 3D structures are handled, representing the evolution of the architecture itself (nodes appearing or disappearing) requires a "4D" approach that is still under development.
- Biological Meaning of Lexicographic Order: Currently, states are ordered mathematically in the 3D probability plots; however, this order doesn't always reflect biological significance.
Conclusion
This paper serves as a manifesto for the "Restitution of Information." As we enter the era of personalized medicine, the ability to design biological information so it can be "read" as easily as a map will be the difference between data-rich confusion and life-saving insight.