
Modeling Social Pulse: A Linear Algebraic Approach to Informational Influence
Informational influence in social networks: dynamics modeling based on the system of linear equations
The paper formalizes "informational influence" in social networks by modeling the dynamics of user interactions (posts, shares, comments, reactions) through a system of linear algebraic equations. It provides a mathematical framework to quantify and predict the "information potential" of different content categories over time.
TL;DR
Information in social networks isn't just data; it's a catalyst for change. This paper proposes a formal mathematical model that treats "Informational Influence" as a dynamic system. By using a system of linear equations, the authors track how "Information Potential" shifts between categories (like politics or tech) based on user interactions like shares, likes, and comments.
The Gap: From Description to Prediction
Most sociological studies of social media are descriptive—they tell us what happened but struggle to predict what will happen. Existing models often fail because they lack:
- Mathematical Formalization: No unified notation for influence factors.
- Standardized Attributes: A lack of clear criteria for what constitutes "influence."
- Dynamic Tracking: Difficulty in accounting for how news popularity diminishes over time.
The authors argue that by treating the total interest of a social network as a "potential" summed to 1, we can model the flow of interest between topics just like a physical system.
Methodology: Quantifying the "Information Potential"
The core of the paper lies in decomposing a social media post into a measurable "cortege" of attributes.
1. The Post Entity
A post is defined as a collection of Content, Reactions (), Shares (), and Comments ():
2. The Influence Equation
The researchers derive the Category Information Potential (), which is the sum of all interactions across all posts in a specific category. To model how this potential evolves from time to , they propose a linear recurrence:
- (Loss Coefficient): Represents the natural decay of interest over time.
- (Revenue Coefficient): Represents the inflow of interest from other areas.
- Unpredicted: A buffer for "breaking news" or resonant events that disrupt normal decay.
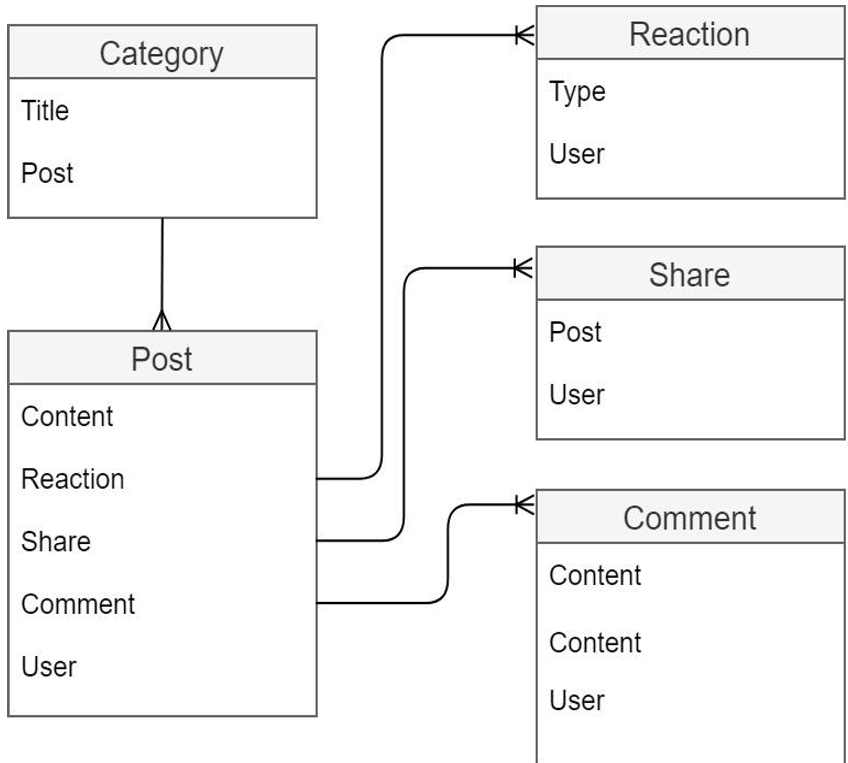 Figure 1: The ER-model showing the relationship between Users, Posts, and interaction types (Comments, Shares, Reactions).
The System of Equations
To ensure the model reflects reality, the authors constrain the system so that the total potential across all categories always equals 1 (). This creates a zero-sum game of attention: for one topic to gain influence, others must lose it, or "unpredicted" events must inject new energy into the system.
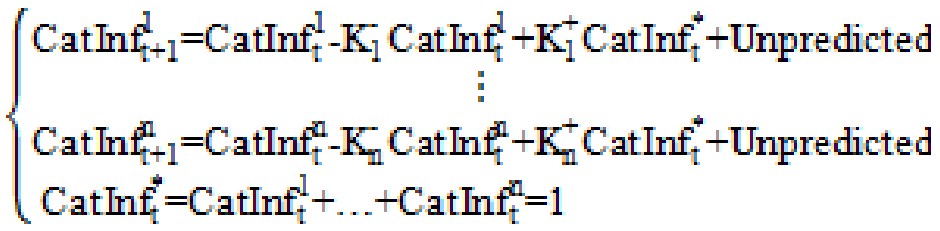 Figure 2: The system of linear algebraic equations used to track multi-category influence dynamics.
Critical Insight & Results
The paper highlights that influence is platform-dependent. For example:
- Quantitative Platforms: (e.g., simple "Like" buttons) rely on simple volume analysis.
- Qualitative Platforms: (e.g., Facebook's varied reactions like 'Angry' or 'Wow') require sentiment context to determine if the "influence" is constructive or destructive.
By using Support Vector Machines (SVM) and Hidden Markov Models (HMM) for initial text classification, the system can automatically sort posts into categories before applying the linear dynamics model.
Conclusion & Future Outlook
This framework moves social network analysis toward a more "hard science" footing. By using linear algebra, researchers can better predict the decline curve of news cycles and identify "influencers" not just by their follower count, but by their contribution to the "Information Potential" of specific niches.
While the model is currently theoretical, its flexibility allows for the addition of site-specific features (like Twitter's retweet vs. Facebook's share), making it a robust starting point for real-time social sentiment dashboards.