
Beyond Individual Genes: Integrating Gene Ontology for Precision Biomarker Discovery
Integrating Gene Ontology Based Grouping and Ranking into the Machine Learning Algorithm for Gene Expression Data Analysis
The paper introduces a novel integrative gene selection method that leverages Gene Ontology (GO) terms to group and rank genes for 2-class classification. By embedding domain knowledge into a Random Forest-based machine learning pipeline, the approach identifies significant biological functional groups as biomarkers across 8 different gene expression datasets.
The explosion of high-throughput sequencing has provided us with a wealth of transcriptomic data. However, the "p >> n" problem (thousands of genes vs. dozens of samples) remains a formidable barrier. Traditional feature selection methods often strip away the biological context, treating genes as mere numbers. This paper presents a paradigm shift: Integrating Gene Ontology Based Grouping and Ranking into Machine Learning.
TL;DR
The authors propose a machine learning framework that doesn't just look for "important genes" but identifies "important biological functions." By grouping genes based on Gene Ontology (GO) terms and ranking these groups using Random Forest, the method achieves superior classification performance (up to 22% AUC improvement over baselines) across multiple diseases like Parkinson's and Prostate Cancer.
The Core Challenge: The Gap Between Math and Biology
Computational feature selection (like Information Gain or ReliefF) is mathematically sound but biologically blind. A list of 50 disconnected genes is hard for a doctor to interpret. Furthermore, individual gene signals can be noisy. The authors argue that since genes act in coordinated functional units (pathways, cellular compartments), our machine learning models should reflect this modularity.
Methodology: The Group and Rank Algorithm
The proposed workflow transforms the feature space from individual genes to functional sets.
- CreateGroups: The system maps genes to GO terms. Each group represents a specific biological process (e.g., "Mitochondrial genome maintenance").
- RankGroups: Instead of ranking genes, the algorithm trains a Random Forest (RF) on each GO group. The groups are ranked based on their average accuracy in distinguishing between classes (e.g., Disease vs. Control) using Monte Carlo Cross Validation.
- Model Aggregation: The top-performing groups are combined to build the final, highly interpretable diagnostic model.
 Figure 1: Conceptual overview of the integration of biological knowledge into the ML pipeline.
Experiments and Results
The authors tested their approach on 8 diverse datasets from the Gene Expression Omnibus (GEO).
Performance vs. Interpretabilty
One of the most striking findings is the relationship between the number of groups used and the model’s performance. As shown in the table below, using just the top 2 GO groups (comprising roughly 21.8 genes) yielded an AUC of 0.97. Adding more groups (up to 10) provided diminishing returns, suggesting that biological signals are concentrated in specific functional modules.
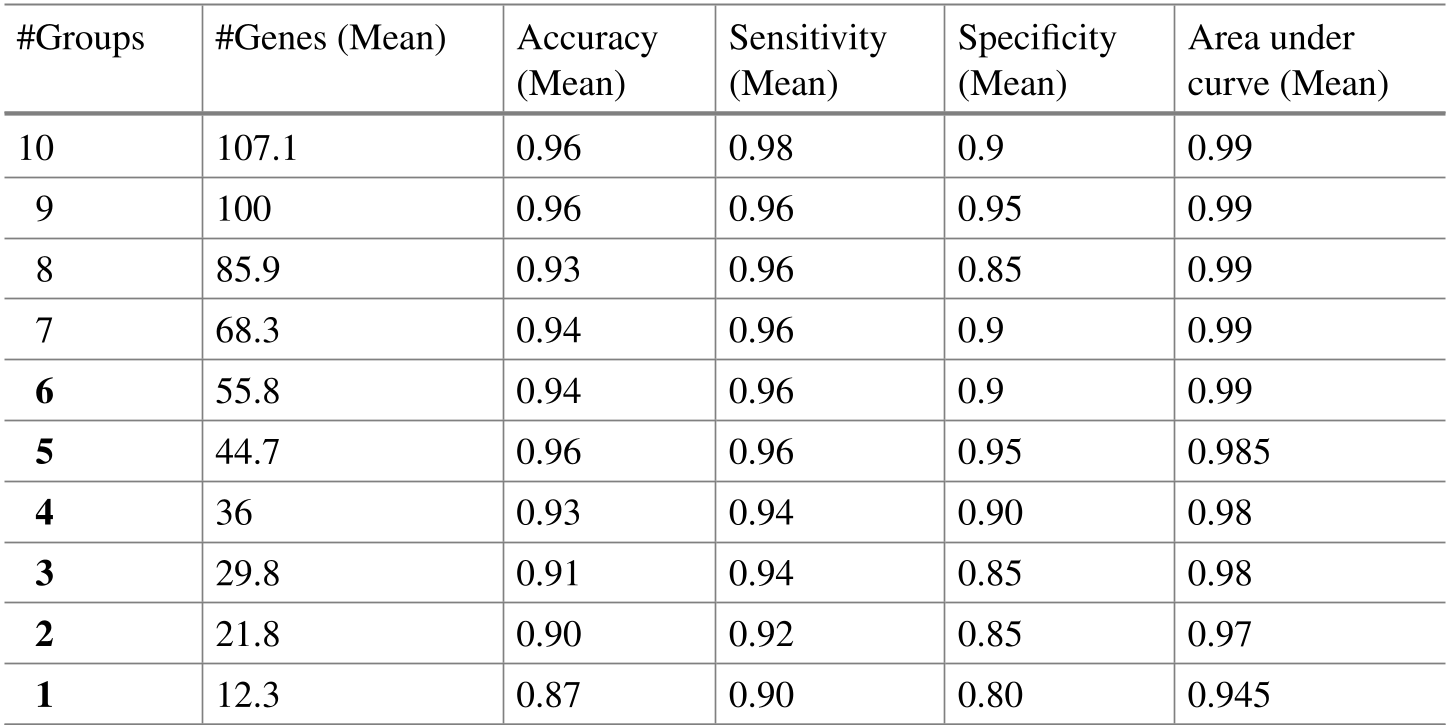 Table 1: Performance metrics as the number of ranked GO groups increases.
SOTA Benchmarking
The tool was compared against maTE (microRNA Targets Enrichment). In 7 out of 8 datasets, the GO-based integration was superior. For instance, in GDS2519 (Parkinson's), this method achieved significantly higher AUCs, demonstrating that GO terms provide a more robust inductive bias than microRNA targets for these specific phenotypes.
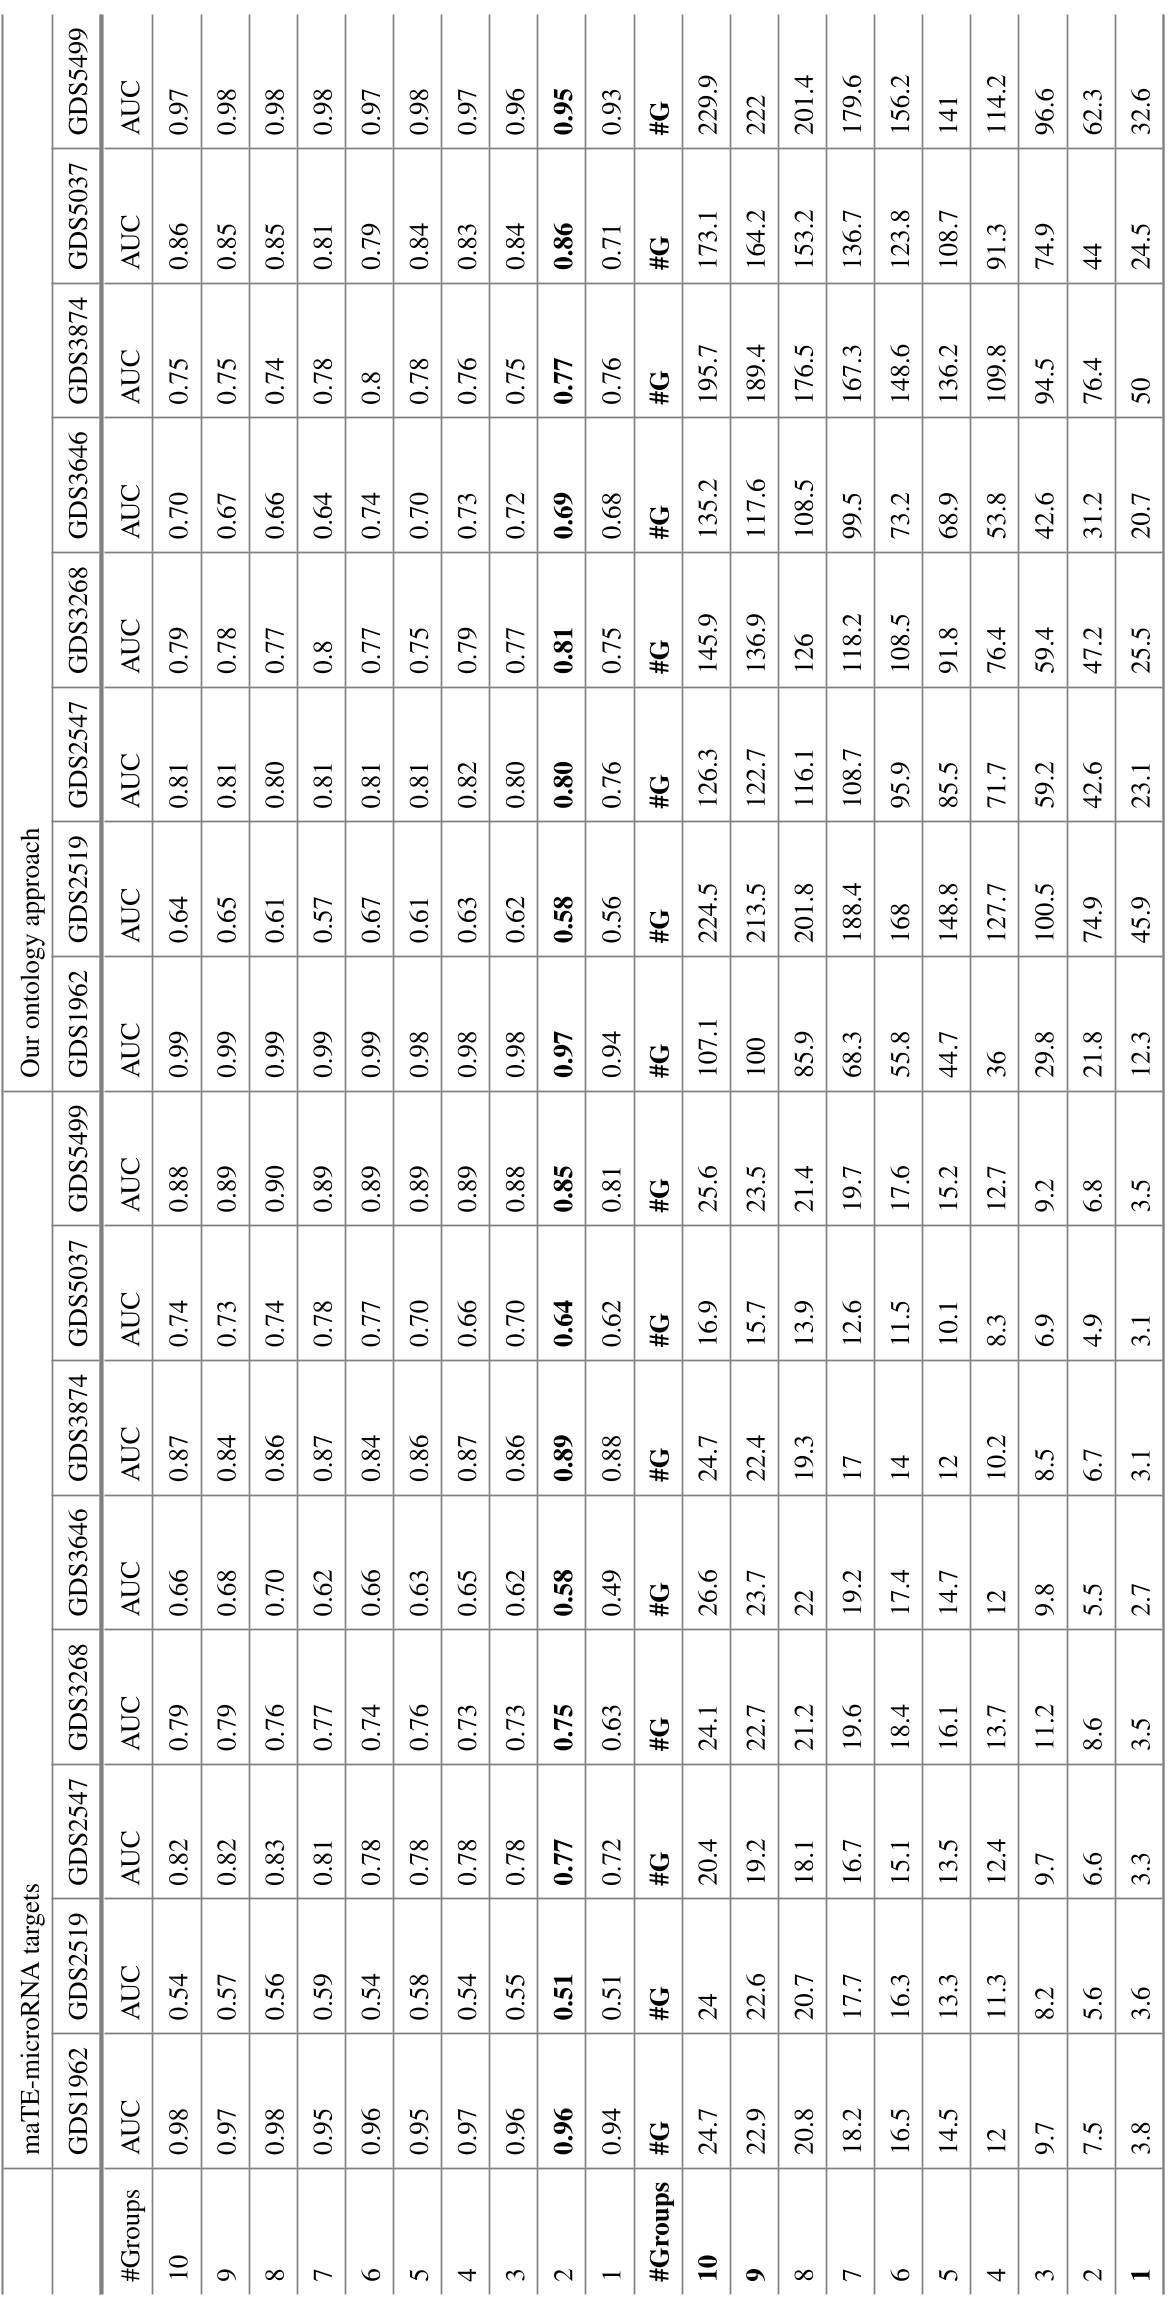 Table 2: Comparative AUC and gene counts across 8 datasets (GDS prefix).
Critical Insight: Why This Works
The "magic" here lies in the reduction of the search space. By shifting the focus from ~50,000 genes to ~7,500 GO terms, the algorithm effectively filters out noise. Since the genes within a GO group are functionally related, their collective signal is more stable across different patient samples than any single gene signal might be.
Conclusion & Future Outlook
This work proves that "more data" isn't always the answer—"smarter data" is. By embedding 20 years of GO Consortium knowledge into a Random Forest, we get models that are not only more accurate but also explainable to the medical community.
Limitations: The current approach relies on predefined GO terms. Future work could involve Dynamic Grouping where the algorithm learns to adjust the boundaries of these groups based on the specific transcriptomic landscape of a disease.
Takeaway for Practitioners: When dealing with high-dimensional biological data, stop looking for solo performers. Start looking for the orchestra.