
Beyond the Survey: How City Function Dictates the Value of Social Media in Transport Planning
Integrating Household Travel Survey and Social Media Data to Improve the Quality of OD Matrix: A Comparative Case Study
This paper evaluates the integration of Twitter/Foursquare data with traditional Household Travel Surveys (HTS) to improve Origin-Destination (OD) matrix estimation. Utilizing Random Forest regression across eight US cities, the researchers demonstrate that social media serves as a potent auxiliary data source for travel demand modeling, particularly in metropolitan contexts.
TL;DR
Is Twitter actually useful for predicting city-wide traffic? This study proves the answer is a resounding "yes"—but only if you know what kind of city you are looking at. By applying Random Forest regression to data from eight US cities, researchers found that social media data boosts travel demand model accuracy by up to 17% in metropolitan hubs, whereas its impact in tourist towns is nearly negligible.
The Data Gap: Why Surveys Aren't Enough
For decades, urban planners have relied on Household Travel Surveys (HTS). While accurate, HTS is the "slow fashion" of the data world: it’s expensive, infrequent, and requires massive manual labor. In an era of rapid urbanization, waiting five years for a survey update is a luxury planners can no longer afford.
Social media data (Twitter and Foursquare) offers a "fast data" alternative. However, the industry has long struggled with two problems:
- Non-linearity: Travel demand doesn't follow a simple straight line relative to population or social media posts.
- Generalizability: Does a method that works for Los Angeles work for a rural town in Idaho or a beach resort in Florida?
Methodology: Fusing Social Signals with Random Forests
The researchers chose Random Forest (RF) regression because of its ability to handle complex, non-linear relationships without overfitting. They categorized eight cities into three groups: Metropolis (Atlanta, Chicago, Seattle, Baltimore), Rural (CUS, Idaho), and Tourist (Daytona Beach, NE Florida).
The models integrated three distinct data streams:
- Twitter: Trips inferred when a user moved between suburbs within a 4-hour window.
- Foursquare: Check-ins across seven venue types (e.g., Professional, Shopping, Nightlife) to act as a proxy for land use.
- Socio-demographics: Population density, housing, and ZCTA-level census data.
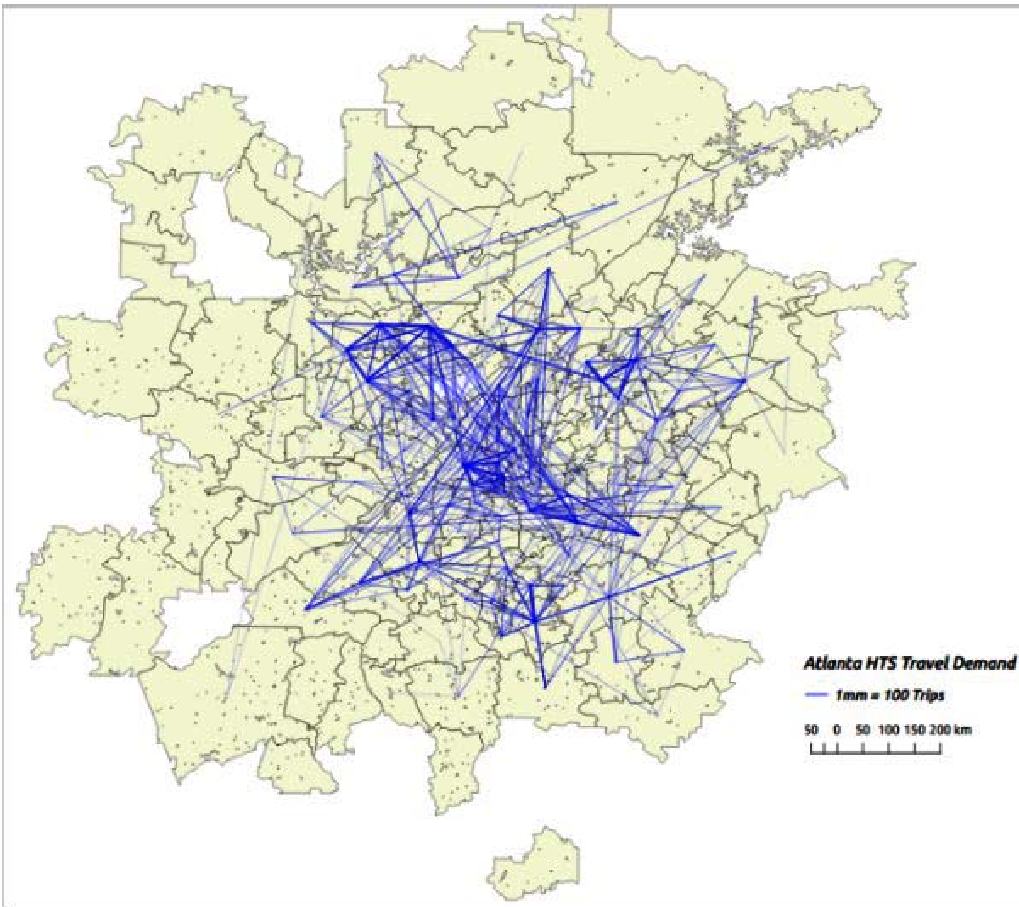 Figure 1: Visualization of the O-D links in Atlanta used for the Random Forest model training.
Key Insights: Not All Cities Are Created Equal
The study's most striking finding is the RMSE (Root Mean Square Error) improvement shown in the table below.
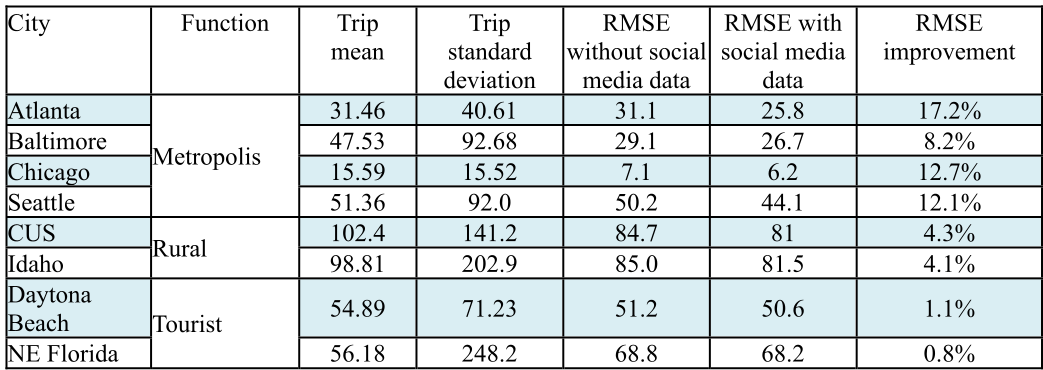 Table 1: Comparison of RMSE with and without social media data across different city functions.
1. The Metropolis Mastery
In cities like Atlanta (17.2% improvement) and Chicago (12.7% improvement), social media data was highly effective. Why? Because social media users in these areas are often residents whose digital footprints align with their daily commuting and professional habits.
2. The Tourist Trap
In Daytona Beach and Northeast Florida, the improvement was a measly 0.8% to 1.1%. The authors identified a "mismatch" problem:
- HTS data primarily captures the movement of local residents.
- Twitter data in these areas is dominated by tourists visiting specific landmarks (beaches, airports). Digital footprints of visitors do not reflect the general travel demand of the local transport network.
3. Purpose and Mode Sensitivity
The research further teased out that social media is best at predicting Professional (Work/School) trips and Private Car usage. Professional trips are repetitive and "sticky," making them easier for machine learning algorithms to learn and predict from sparse digital signals.
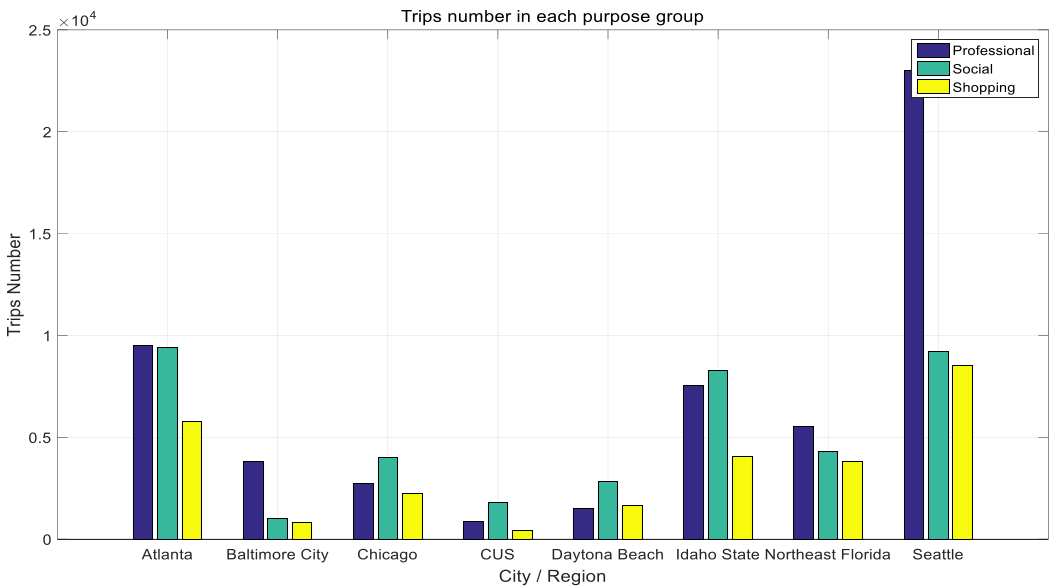 Figure 2: Distribution of trips by transport mode—Private cars dominate the signal.
Critical Analysis & Future Outlook
This paper serves as a vital reality check for "Big Data" enthusiasts in urban planning. It highlights that social media is an auxiliary tool, not a total replacement for traditional surveys.
Limitations: The reliance on data around 2010 (due to HTS sync) and the declining use of public Geotagging on Twitter in recent years may impact the reproducibility of these specific results today.
Future Directions: To make social media data viable for tourist regions, future researchers must develop "User-Type Classifiers" to filter residents from visitors before training the OD prediction models. By integrating state-of-the-art Neural Networks with this "city-function aware" approach, we could move toward truly dynamic, real-time urban planning.