
Intelligent Tree Planning: Using Social Mobility to Heal Urban Deserts
An Intelligent Tree Planning Approach Using Location-Based Social Networks Data
The paper introduces an intelligent tree-planting framework that leverages Location-Based Social Networks (LBSN) data from New York City and Paris. By analyzing human mobility patterns through graph-based metrics and community detection, the authors propose four data-driven policies—Degree, Tree Density, Community Tree Density, and Pareto Ranking—to optimize urban greenery placement for maximum exposure and social equity.
TL;DR
Where should a city plant its next 1,000 trees? Traditionally, we look at where there is space. This paper argues we should look at where the people are. By analyzing LBSN (Location-Based Social Network) data from New York and Paris, the researchers developed a graph-based framework that places trees based on citizen movement patterns. They found that prioritizing popular or tree-deprived "communities" of venues can significantly increase human-nature contact and reduce urban inequality.
Problem: The Blind Spots of Urban Planning
Urban greenery isn't just an aesthetic luxury; it's a mitigator for the "Heat Island" effect and air pollution. However, current site-selection frameworks are often static. They focus on soil quality, biological fitness, or visual aesthetics but ignore the socio-cultural dimension: the actual humans moving through these spaces.
If a tree is planted in a location where no one walks, its socio-cultural value is wasted. Conversely, if a community spends most of its day moving between "concrete deserts," their overall well-being suffers. This paper addresses the gap by asking: How can we use mobility data to ensure the most people—especially those in tree-deprived groups—actually encounter nature?
Methodology: The City as a Social Graph
The researchers treated New York and Paris as undirected network graphs .
- Nodes (): Venues (cafes, parks, stations).
- Edges (): Movements between venues.
- Weights (): Frequency of travel.
- Tree Density (): Existing trees within a 25m radius.
The Four Strategic Policies
- Policy 1 - Degree (Popularity): Plant trees where the most people pass by. High-traffic nodes get priority.
- Policy 2 - Tree Density (The Gap-Filler): Target venues that currently have the fewest trees nearby.
- Policy 3 - Community Tree Density (The Contextual Move): This is the paper's most novel contribution. It uses the Leiden Algorithm to find "communities" of venues that people frequent together. If a whole community of venues is tree-sparse, the nodes within it are prioritized.
- Policy 4 - Pareto Ranking: A multi-objective optimization that tries to find the "sweet spot" between high popularity (Policy 1) and high need (Policy 3).
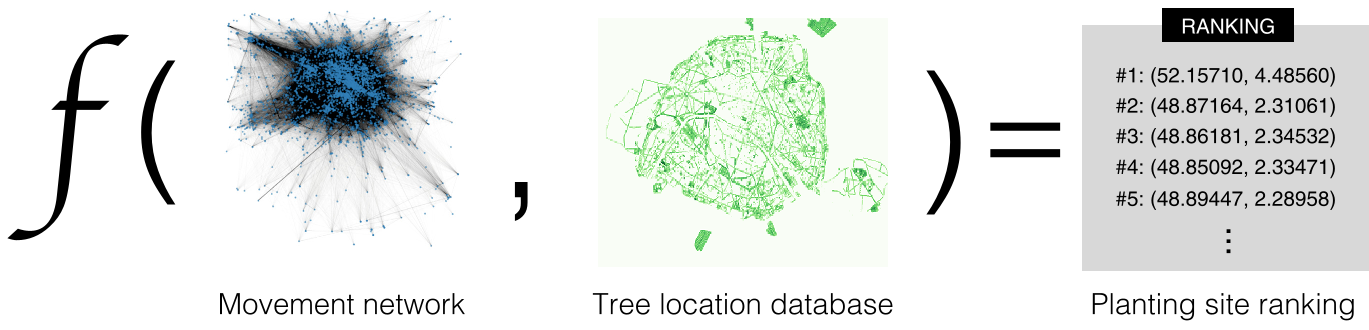 Figure 1: Conceptual workflow of integrating LBSN data with tree density for site ranking.
Experimental Insights: NYC vs. Paris
The team simulated the movement of thousands of citizens (random walks based on real check-in weights) to test these policies.
Key Findings:
- The "Green-Get-Greener" Risk: In NYC, the Degree policy was the most efficient at increasing total tree encounters. However, this often reinforces existing popular areas.
- Targeting Inequality: Looking at the data in "bins" (from least-exposed to most-exposed citizens), the Community Tree Density policy was vastly superior at helping the "tree-poor" segments of the population.
- City-Specific Dynamics: In Paris, simply filling the lowest density areas (Policy 2) worked better than the degree-based approach, suggesting that Paris's movement is distributed differently than NYC's hub-and-spoke style.
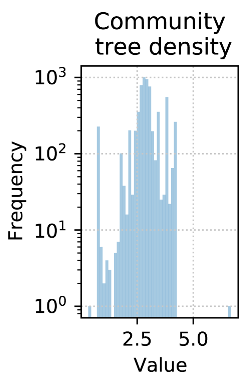 Figure 2: Distribution of values for different selection policies in New York City.
Critical Analysis & Conclusion
This work pushes Urban Computing into a more "human-centric" era. The use of Community Detection is particularly clever—it recognizes that a lack of trees at one's workplace matters less if their commute and lunch spots are lush, but matters critically if their entire daily "orbit" is barren.
Limitations
- Data Bias: LBSN data (Foursquare) tends to skew younger and more tech-savvy. It might not reflect the movement of elderly residents or children.
- Data Quality: Tree censuses are notoriously difficult to keep up-to-date.
The Takeaway
The paper proves that social network analysis is a viable tool for physical urban engineering. Whether it's planting trees, placing waste bins, or installing benches, "Intelligent Planning" should prioritize the daily trajectories of citizens to maximize social ROI and equity.
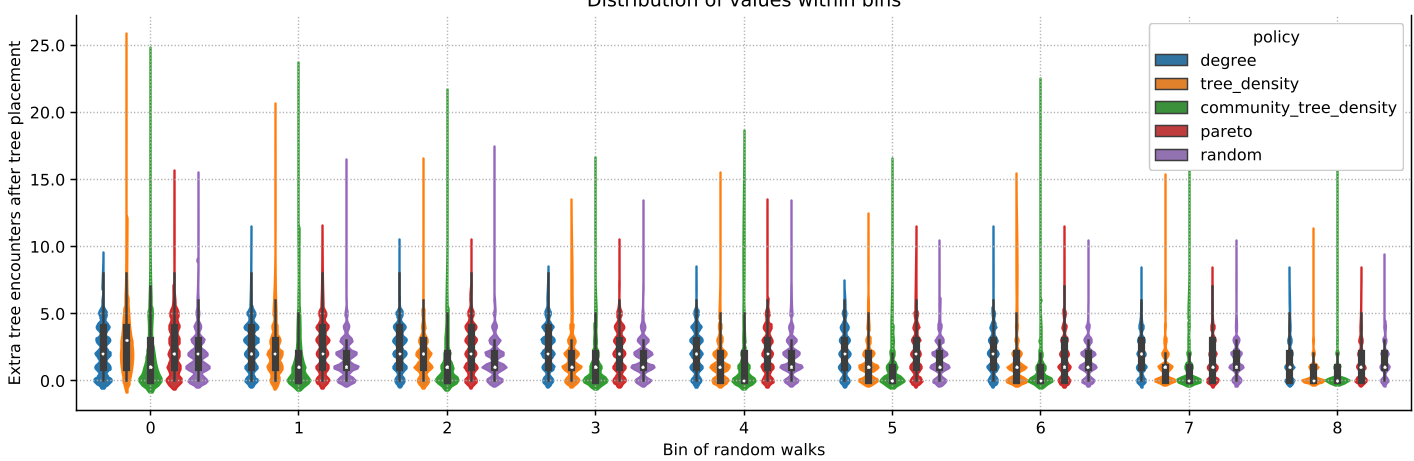 Figure 3: Improvement in tree encounters across different population segments (bins).