
Deciphering Indonesia's Trade DNA: A Social Network Analysis of Interregional Connectivity
Analysis of Interregional Trade Network Structure: A Case Study of Indonesia
This paper performs a Social Network Analysis (SNA) on Indonesia's interregional trade network using national tax invoice data from 2016-2019. By applying triad census and structural balance theory, it identifies the network's underlying structure as a Hierarchical Cluster model and quantifies integration levels across different islands.
TL;DR
Researchers from the University of Indonesia have mapped the country's economic pulse by treating its 514 cities as nodes in a massive social network. By analyzing over four years of tax invoice data through the lens of Triad Census and Structural Balance Theory, the team discovered that Indonesia's trade follows a "Hierarchical Cluster" model. While Java acts as a highly interconnected core, the rest of the archipelago remains loosely integrated, dominated by "null" relationships.
The Structural Mystery of Archipelagic Trade
Indonesia’s geography—an archipelago of 17,000+ islands—presents a unique logistical challenge. Historically, the government understood trade connectivity through periodic surveys. However, surveys are snapshots, not continuous streams. With the rise of e-government and digitized tax systems (VAT invoices), we now have a "population-level" view of every formal transaction between cities.
The core question isn't just "who sells to whom," but "what is the fundamental shape of the network?" Does it form closed, balanced circles, or is it a top-down hierarchy?
Methodology: The Power of Three (Triads)
The researchers moved beyond simple "A-to-B" connections (dyads) to study "A-B-C" relationships (triads). In a directed graph, there are 16 possible ways three cities can be linked.
The Analytical Framework
The study utilized Pajek and NetworkX to perform a triad census. They looked for the "Balance Model"—a concept from social psychology that suggests networks evolve toward stable, "balanced" states to reduce tension.
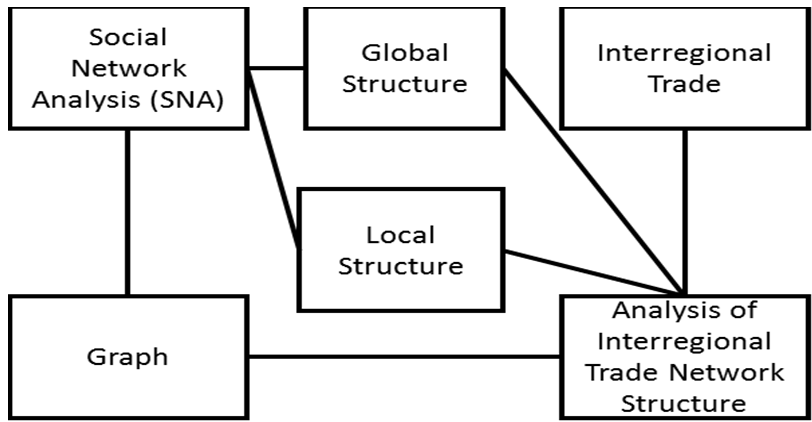
By comparing the actual frequency () of these triads against the expected frequency () in a random graph, they could see which patterns "survived" the chaos of the market.
Key Findings: Hierarchy Over Equality
The analysis of 2016–2019 data revealed a consistent pattern. Certain triad types were statistically significant (p < 0.001):
- Type 300 (Mutual Balance): Three cities all trading with each other symmetrically.
- Type 210: Two mutual links and one single directed link.
- Type 120C: A "cyclic" or hierarchical flow.
The Hierarchical Cluster Model
This specific combination points to a Hierarchical Cluster Model. Unlike a simple "Balanced" model where everything is symmetric, the Indonesian trade network allows for asymmetric links.
- Insight: Cities are ranked by demand. Trade naturally flows from lower-ranked (supply) nodes to higher-ranked (demand) nodes. Within clusters (like Greater Jakarta), links are more symmetric, but between clusters, the hierarchy takes over.
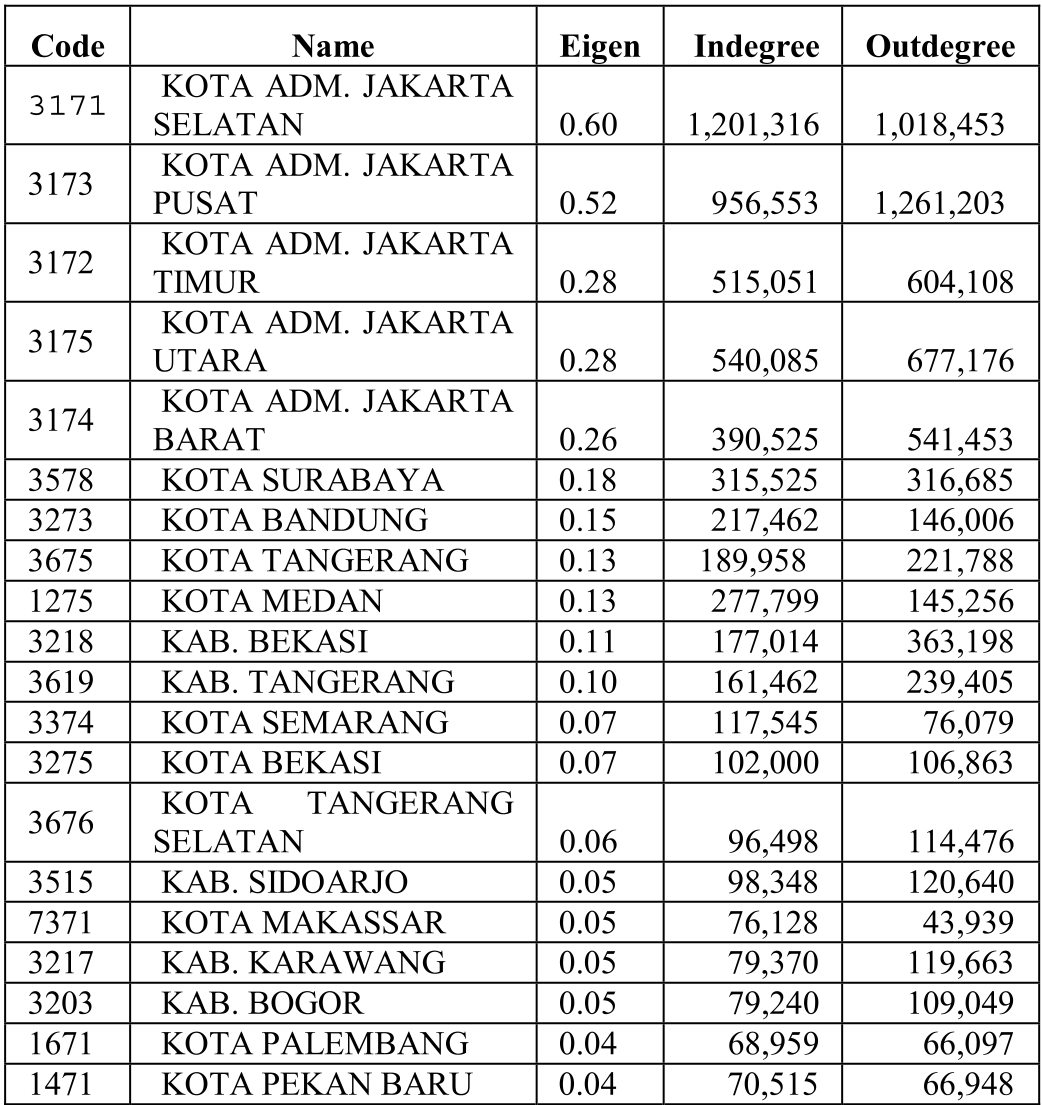 The top 20 cities are overwhelmingly dominated by the Jakarta administrative regions (Jakarta Selatan, Pusat, Timur).
The Integration Gap
The most sobering result of the study is the Density and Null Triad (003) count.
- Density: Only about 14% of potential trade links are actually realized.
- Type 003: 58% of the triads in the network are "Null," meaning three cities with no trade between them.
When zooming into specific islands, the disparity is stark:
- Java: 35.2% of triads are Type 300 (highly integrated, mutual trade).
- Sumatera, Sulawesi, Papua: Over 50% are Type 003 (null).
Critical Analysis & Future Outlook
This paper successfully moves trade analysis from "economic intuition" to "topological evidence." It proves that Indonesia’s "Economic Integration" is currently a Javanese phenomenon rather than a national one.
Limitations: The study relies on VAT (Value Added Tax) invoices. This captures formal trade but misses the booming informal economy and smaller e-commerce transactions that may not trigger a formal tax invoice.
The Takeaway: For policymakers, the goal shouldn't just be "more trade," but "balancing the triads." Moving a region from a Type 012 (single link) to a Type 300 (mutual links) requires not just transport infrastructure, but a shift in the demand-supply hierarchy that currently funnels everything toward Java.