
From OS Events to Architecture: The Art and Friction of Trace-Based Performance Modeling
Issues Arising in Using Kernel Traces to Make a Performance Model
The paper investigates the challenges and methodologies for deriving Layered Queueing Network (LQN) performance models from Linux kernel traces (specifically LTTng). It compares direct trace analysis with predictive model-based abstraction, identifying key gaps in kernel-level visibility and proposing hybrid data integration strategies to enhance model accuracy.
TL;DR
Understanding how a complex software system behaves at scale often requires more than just high-level monitoring; it requires a performance model. This paper dives into the messy reality of building these models—specifically Layered Queueing Networks (LQNs)—directly from Linux kernel traces. While kernel traces (via LTTng) offer a non-intrusive "God's eye view" of CPU scheduling and I/O, they suffer from a "semantic gap" that makes it hard to see the application's true logic.
The Semantic Gap: Why Raw Traces Aren't Enough
Performance analysts face a fundamental trade-off. Direct trace analysis (like "wait analysis") is great for diagnosing what happened during a specific window, but it can't predict what will happen if you double the load or change the hardware. For that, you need a generative performance model.
The authors point out that kernel traces are incredibly detailed but socially "blind." They see a thread waiting, but they don't necessarily know if it's waiting for a database lock, a network packet from a remote microservice, or just being throttled by the OS scheduler.
Methodology: Building Layers from Low-Level Signals
The core of the research involves extracting Layered Performance Models. Unlike standard queueing models, these account for both hardware (CPUs, disks) and software (task pools, critical sections).
1. The Extraction Logic
The authors use patterns of inter-process messages to define the architecture. By observing when a process blocks and which thread wakes it up, they can automatically generate a model structure.
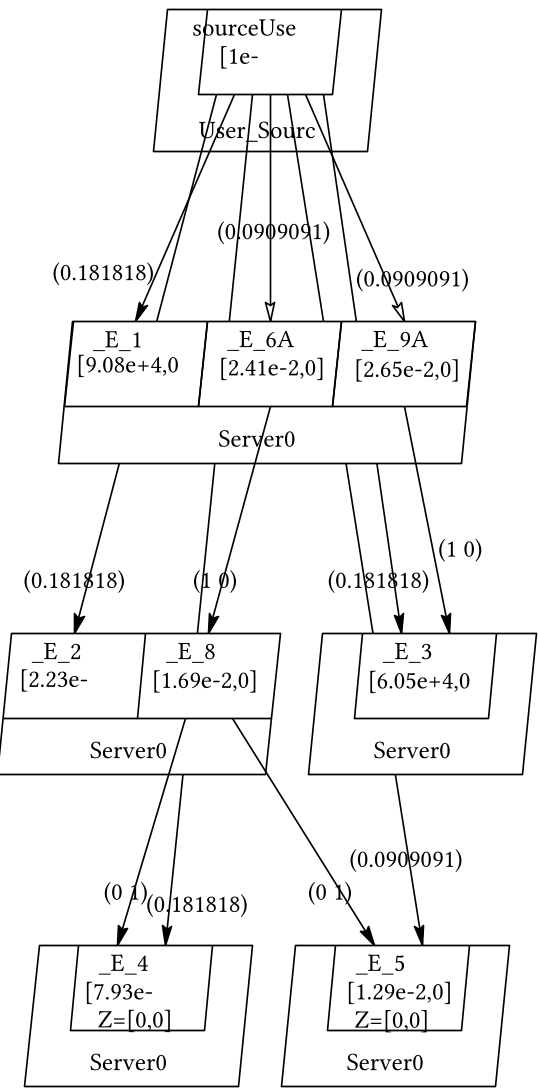 Figure 2: An automatically extracted performance model showing tasks (boxes), entries (operations), and the flow of service calls.
2. Overcoming Kernel Limitations
To solve the "blindness" of kernel traces, the paper suggests several tactical patches:
- Identity Mapping: Querying the
/procfilesystem to link opaque Process IDs (PIDs) back to meaningful application names. - Causality Inference: If a process stops for a reason not captured by a syscall, it's likely a software-level lock. The model builder can "hypothesize" a hidden queue to represent this contention.
- Middleware Awareness: In microservices, messages often go through a broker (like RabbitMQ). The authors argue that tracing the middleware is non-negotiable for connecting the "sender" to the "receiver."
Critical Analysis: Clutter and Calibration
One of the most insightful parts of the paper is the discussion on "Model Clutter." A raw trace includes everything—initialization, cleanup, and background heartbeats. This creates a noisy model (see Figure 2 vs Figure 1).
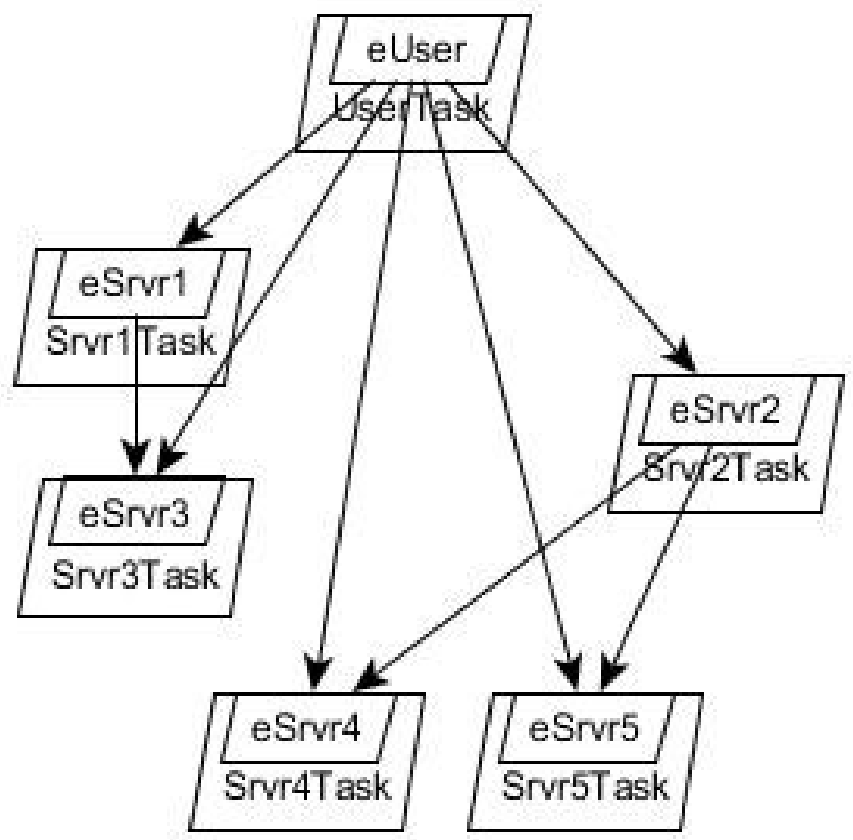 Figure 1: The idealized architecture the analyst has in mind.
The study reveals that to get a "clean" model, analysts must proactively mark "boundary events" (e.g., when the system enters its steady-state production phase) to filter out the irrelevant OS noise.
Conclusion and Future Outlook
The paper concludes that while kernel traces are a goldmine for performance data, they require semantic enrichment. Future breakthroughs in this field likely won't come from better tracers, but from better inference engines—perhaps using AI to bridge the gap between a low-level context_switch and a high-level UserPurchaseRequest.
For engineers building large-scale distributed systems, the takeaway is clear: don't rely on OS traces alone. Build your systems with "traceable" middleware to ensure that when your performance model encounters a bottleneck, it knows exactly which service to blame.
Key Takeaways:
- Generality vs. Specificity: Direct trace analysis is diagnostic; models are predictive.
- Non-Intrusiveness has a cost: The less you instrument the app, the harder you have to work to infer its meaning.
- Middleware is the key: In modern stacks, the kernel only sees half the story; the middleware knows the "Why."