
Forecasting Type 2 Diabetes: A 2-Year Predictive Window Using KNN and Longitudinal Trends
Use of a K-nearest neighbors model to predict the development of type 2 diabetes within 2 years in an obese, hypertensive population
This study presents a predictive model using K-Nearest Neighbors (KNN) and Random Forest (RF) to forecast the development of Type 2 Diabetes Mellitus (T2DM) within a 2-year window. Focused on obese, hypertensive patients, the hybrid approach achieves a peak accuracy of 99.7% by utilizing longitudinal trends of clinical features.
TL;DR
Researchers have developed a machine learning model capable of predicting Type 2 Diabetes Mellitus (T2DM) onset two years in advance with 99.7% accuracy. By focusing on the slopes (trends) of clinical data rather than static values, the model identifies "progressors" in high-risk hypertensive populations, providing a vital window for preventive intervention.
The "Classification vs. Prediction" Gap
Most AI research in diabetes focuses on classification—answering the question, "Does this patient have diabetes now?" However, for clinicians, the more valuable question is prediction: "Will this patient develop diabetes in the near future?"
Current clinical tools like the FINDRISC score are useful but often lack the precision needed for specific high-risk cohorts (obese, hypertensive). The authors of this study identified that the key to unlocking predictive power lies not in single snapshots of health, but in the longitudinal trajectory of a patient's biomarkers.
Methodology: From Time-Series to Slopes
The researchers analyzed data from 1,647 patients collected over 13 years (2005–2018). Instead of raw data points, they engineered a novel feature set based on temporal trends.
1. Trend Extraction
For every feature (BMI, Insulin, etc.), the team calculated a linear regression line within an "observation window." The resulting slope () represented the rate of change for that specific biomarker.
2. The 2-Year Prediction Window
Crucially, the researchers excluded all data from the 2 years immediately preceding a T2DM diagnosis. This "blind spot" ensures the model is truly predicting future onset rather than just detecting the early symptoms of existing disease.
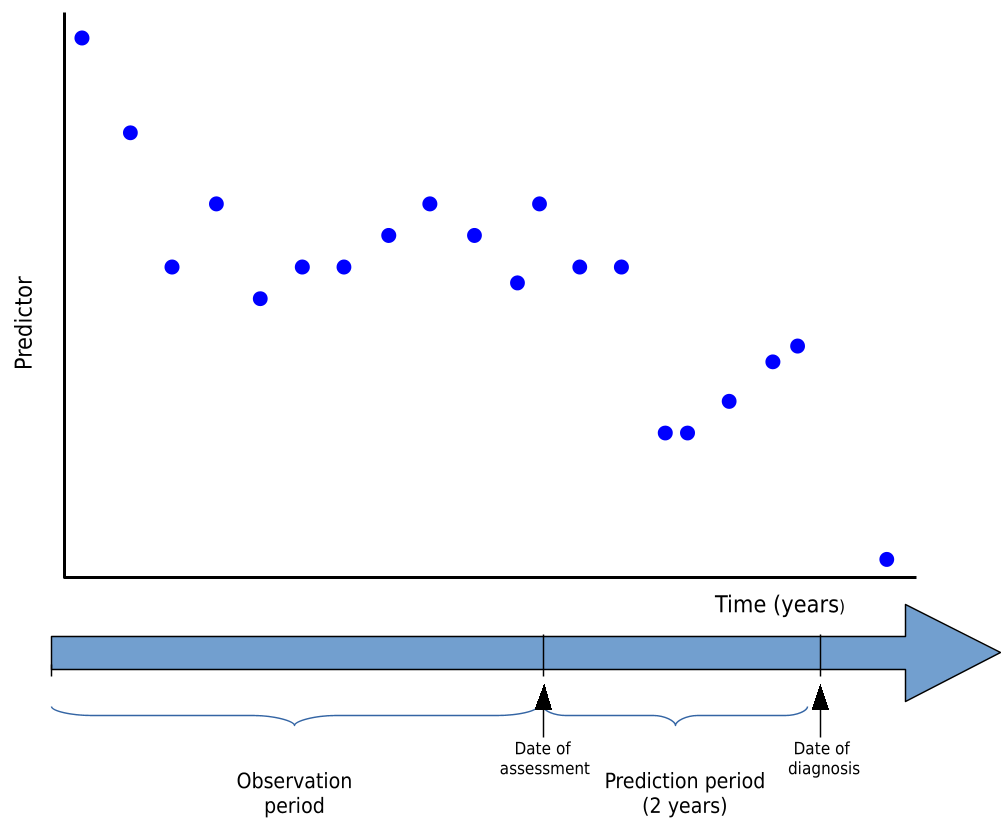 Fig 1: The temporal framework showing the Observation Window vs. the 2-year Prediction Window.
3. Algorithm Synergy: KNN + Random Forest
- K-Nearest Neighbors (KNN): Used for the final classification. It works by finding the "most similar" historical patients in the feature space.
- Random Forest (RF): Used for Feature Importance. RF identified which slopes actually mattered, allowing the team to strip away "noise" variables like ferritin and albuminuria.
Experimental Results: Precision in Prediction
The results were striking. While the baseline KNN model was highly effective, the Parsimonious Model (using only the top 3 features) delivered near-perfect metrics.
| Metric | Full KNN Model | Optimized Subset (KNN + RF) |
|---|---|---|
| Accuracy | 97.7% | 99.7% |
| Sensitivity | 99.8% | 99.0% |
| Specificity | 83.8% | 84.0% |
| AUC | 0.89 | 0.90 |
The "Power Trio" of Features
The Random Forest analysis revealed that the three most critical predictors were the trends in:
- HOMA-IR (Insulin Resistance)
- Insulin levels
- BMI (Body Mass Index)
Interestingly, variables like Systolic Blood Pressure and LDL cholesterol—while important for general health—were less "predictive" of the specific transition to T2DM compared to the insulin-related markers.
 Fig 2: The AUC-ROC curve demonstrating the excellent discriminatory power (0.90) of the optimized model.
Clinical Insight: Why This Matters
The 2-year prediction window is a "sweet spot" for medicine. It is short enough for the model to remain highly accurate, yet long enough for a physician to implement aggressive lifestyle changes—such as weight loss and diet—that can potentially reverse the progression of insulin resistance before beta-cell damage becomes permanent.
Critical Analysis & Limitations
- Population Specificity: The study was conducted on a specific cohort (obese and hypertensive). While the model is incredibly accurate for this group, it requires external validation before being applied to the general, non-hypertensive population.
- Feature Availability: Markers like HOMA-IR and fasting insulin are not always part of routine primary care checkups, which might limit the model's immediate deployment in lower-resource settings.
Conclusion
This study proves that "Data is the best medicine." By leveraging longitudinal EHR data through simple yet robust algorithms like KNN and RF, we can move from reactive treatment to proactive prevention. For the millions of patients living with prediabetes, this 2-year warning could be the difference between a healthy life and a lifelong chronic condition.