
Decoding the Grade: A Multivariate Framework for Intelligent Knowledge Mining
Abstract-A new knowledge mining framework based on multivariate analyses is proposed to discover and simulate the school grading policy. The framework comprises three major steps. Firstly, factor analysis is adopted to separate the scores of several different subjects into grading-related ones and grading-unrelated ones. Secondly, multidimensional scaling is employed for dimensionality reduction to facilitate subsequent data visualization and interpretation. Finally, a support vector machine is trained to classify the filtered data into different grades. This work provides an attractive framework for intelligent data analysis and decision-making. It also exhibits the advantages of high classification accuracy and supports intuitive data interpretation
This paper introduces an intelligent knowledge mining framework that combines Factor Analysis (FA), Multidimensional Scaling (MDS), and Support Vector Machines (SVM) to simulate and interpret hidden school grading policies. The methodology successfully extracts grading-relevant features and visualizes complex student performance data to achieve superior classification accuracy.
TL;DR
Researchers from Peking University and Tsinghua Unisplendour Group have developed a robust framework to "reverse-engineer" hidden grading policies in schools. By combining Factor Analysis (FA) for noise removal, Multidimensional Scaling (MDS) for visualization, and Support Vector Machines (SVM) for classification, the system identifies which subjects actually matter for a final grade, boosting prediction accuracy from 84.34% to 97.59%.
Problem & Motivation: The "Black Box" of Human Grading
In many educational systems, final grades (A, B, C, D) are assigned based on multiple subject scores. However, the exact weightings are often unknown, and some subjects may be entirely ignored in the final tally.
From a data science perspective, this presents three challenges:
- Redundancy: Some subjects are highly correlated, while others are "noise" (irrelevant to the grade).
- Non-Metric Labels: Grades are ordinal (ordered categories) rather than continuous intervals, making standard regression ineffective.
- Visualization: It is nearly impossible to "see" the boundaries between grades in a 6-dimensional space (one dimension per subject).
Methodology: The Three-Step Pipeline
The authors argue that before training a classifier, one must understand the latent structure of the data.
1. Feature Selection via Factor Analysis (FA)
Instead of assuming all subjects are equal, the authors used FA to see how subjects "load" onto latent factors. They discovered that subjects 1-4 loaded heavily on one factor (likely the grading criteria), while subjects 5-6 loaded on a separate factor. This allowed them to filter out "unrelated" subjects that would otherwise confuse the classifier.
2. Dimensionality Reduction & Visualization (MDS)
To verify their findings, they used MDS to project the data into a 2D map.
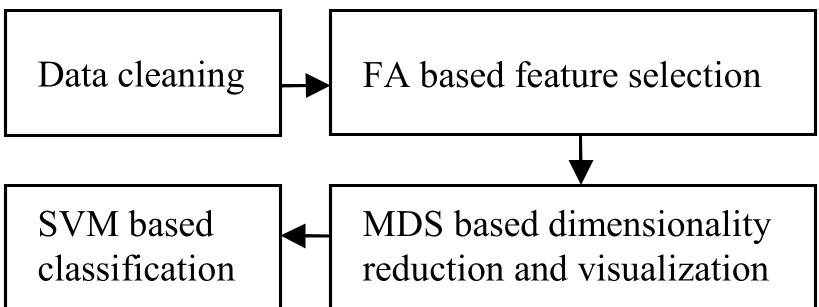 Figure 1: The overall workflow from raw data to final classification.
By comparing the distribution of the full 6-subject dataset vs. the filtered 4-subject dataset, they found that the filtered data showed much clearer boundaries between A, B, C, and D students.
3. Support Vector Classification
With the noise removed and boundaries clarified, the authors applied an SVM. Unlike Decision Trees (which look at one variable at a time) or K-means (which ignores labels), SVM finds the "Maximum Margin Hyperplane"—essentially the safest boundary between two groups.
Experiments & Results: Clear Superiority
The results were striking. By filtering the data using Multivariate Analysis before applying SVM, errors were drastically reduced.
| Method | Accuracy |
|---|---|
| SVM (Filtered Data) | 97.59% |
| SVM (Unfiltered Data) | 84.34% |
| Fisher Discriminant Analysis | 92.17% |
| Decision Tree | 80.72% |
| K-means | 80.12% |
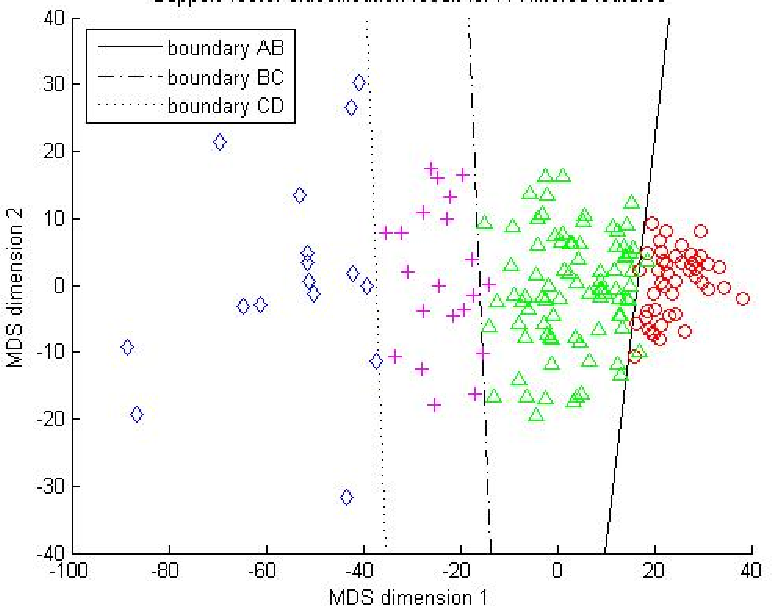 Figure 2: SVM classification boundaries successfully separating the grades in the reduced feature space.
The study reveals that the "unfiltered" data was full of overlapping points, which explains why the classification accuracy was initially lower. The FA/MDS preprocessing acted as a "lens," bringing the underlying policy into focus.
Critical Analysis & Conclusion
Takeaway
This work demonstrates that "Intelligent" data mining isn't just about using the most complex neural network; it's about using classical multivariate statistics to understand the Inductive Bias of the problem. By identifying the latent factors that actually drive decisions, the researchers built a model that is both highly accurate and visually interpretable.
Limitations & Future Work
While highly effective for this dataset, the framework assumes a degree of linearity in the latent factors. Future research could explore Kernel Factor Analysis or Manifold Learning (like t-SNE or UMAP) to handle even more complex, non-linear relationships in larger, more diverse datasets.
Ultimately, this framework provides a blueprint for any decision-making task—from financial credit scoring to medical diagnosis—where the "rules of the game" are hidden within noisy, multidimensional data.