
Decoding the Silent Language of Lines: How Drawing Trajectories Reveal Psychiatric Traits
Large-scale Data Collection for Goal-directed Drawing Task with Self-report Psychiatric Symptom Questionnaires via Crowdsourcing
This study presents a large-scale crowdsourced dataset linking goal-directed drawing trajectories with psychiatric symptom profiles. Using a novel web-based experimental paradigm, the authors collected over 194,000 drawing samples from 1,155 participants alongside 181 self-report items covering SPD, OCD, depression, anxiety, ASD, and ADHD.
TL;DR
Can the way you move a cursor across a screen reveal your mental health profile? A research team from Japan has bridged the gap between motor control and clinical psychiatry by analyzing nearly 200,000 drawing trajectories from 1,155 participants. Their findings suggest that "atypical" drawing paths—moving in roundabout circles rather than straight lines—correlate strongly with latent factors of anxiety, depression, and autism.
Introduction: The Dimensional Shift in Psychiatry
For decades, psychiatry has been defined by rigid "boxes"—you either have a diagnosis or you don't. This categorical approach is increasingly being challenged by the Dimensional Approach. Instead of looking for a single label, researchers search for underlying cognitive traits (latent factors) that span across multiple disorders.
While previous studies linked "mouse cursor jitter" to state anxiety in lab settings, they were often hamstrung by small sample sizes (e.g., just college students). This paper breaks that ceiling by taking the experiment to the web.
The Experiment: A High-Stakes Game of Connect-the-Dots
The researchers designed a deceptively simple "goal-directed drawing task." Participants had to move a virtual cursor from a Starting Point through an Intermediate Target to a Final Goal.
The catch? The virtual cursor’s speed was capped, and its path was recorded every 10ms. Alongside this, participants answered 181 questions across seven clinical scales (including the STAI for anxiety and AQ for autism).
Methodology: Mining Latent Factors
Using Exploratory Factor Analysis (EFA), the team distilled the 181 questionnaire items into three core "Factors":
- Factor 1 (Compulsivity/Impulsivity): Dominated by SPD, OCD, and ADHD.
- Factor 2 (Social/Autistic Traits): Primarily ASD symptoms.
- Factor 3 (Negative Affect): Focused on depression and both state/trait anxiety.
Behavioral Findings: The High-Factor "Roundabout"
When the team visualized the data, a fascinating pattern emerged. While the "Low-Score" groups (the general population average) drew clean, efficient straight lines between dots, the "High-Score" groups—particularly for Factors 2 and 3—showed a much higher density of atypical trajectories.
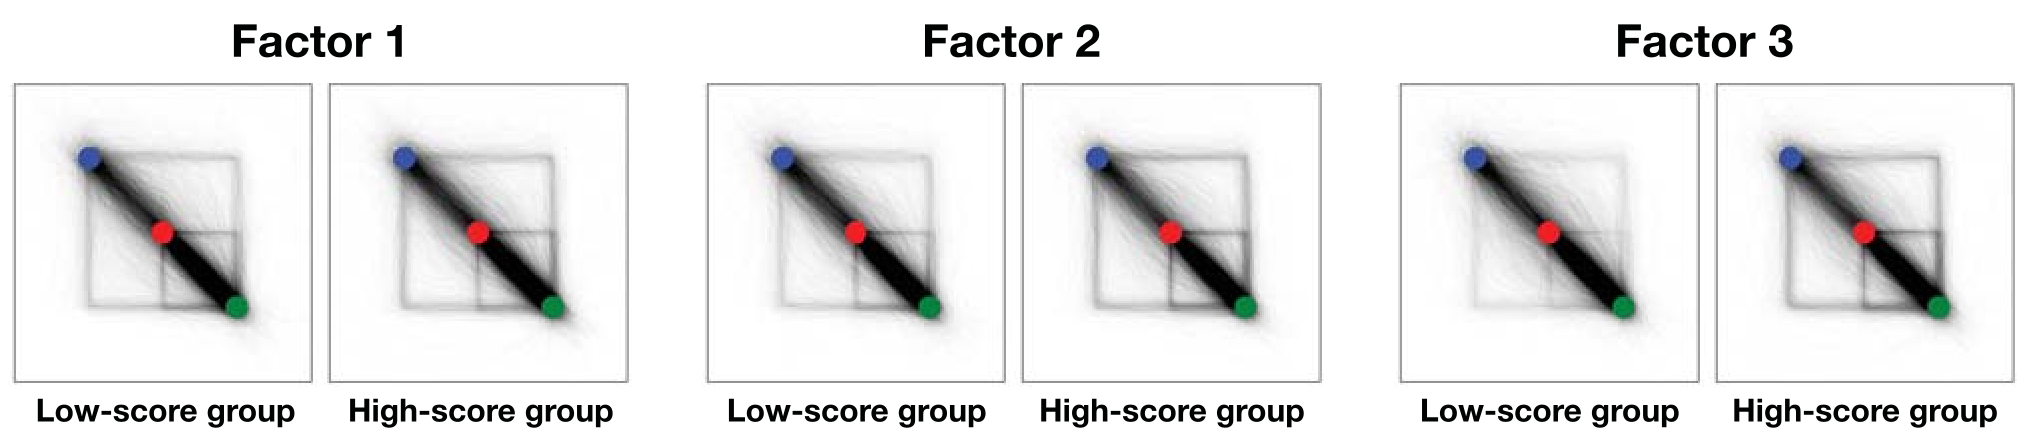
As seen in the figure above, participants with high anxiety or ASD scores were prone to drawing paths that followed the "grids" or took larger, less efficient detours. This suggests a deviation in visuomotor coordination or path planning—low-level motor signatures of high-level cognitive distress.
Digital Biomarkers and the Future
The study's success lies in its scale. Collecting 194,040 trajectory data points allows for a level of statistical granularity impossible in a clinic.
Why this matters:
- Non-Invasive Screening: Drawing tasks could eventually serve as rapid, non-invasive screening tools.
- Computational Phenotyping: We can now "calculate" a personality trait based on the curvature of a line.
- AI Training: The authors intend to use this data to train RNNs (Recurrent Neural Networks) to act as "drawing agents" that mimic specific human psychiatric profiles.
Conclusion
This research proves that our motor movements are not just "noise"—they are a reflection of our internal cognitive state. While the current analysis is qualitative, the groundwork is laid for a future where a quick drawing test on a smartphone could provide a window into a person's mental well-being, helping clinicians move toward more personalized, data-driven psychiatry.
Limitations: The study currently uses qualitative visualization. Future work involving Dynamic Time Warping (DTW) and machine learning will be necessary to turn these "atypical lines" into precise diagnostic metrics.