
TLDA & POPTICS: Optimizing Urban Cultural Landscapes via WeChat Digital Traces
Discovering Latent Patterns of Urban Cultural Interactions in WeChat for Modern City Planning
This paper presents a data-driven framework for urban cultural planning using WeChat check-in data in Beijing. It introduces TLDA (Temporal Latent Dirichlet Allocation) to extract latent cultural interaction patterns and a spatial model to identify regions with mismatched cultural supply and demand.
TL&DR
Managing a megacity's cultural budget involves tens of millions of dollars. This paper introduces a sophisticated framework that uses WeChat Moments check-ins to map the "cultural soul" of Beijing. By combining a novel Temporal Latent Dirichlet Allocation (TLDA) model with a personalized spatial clustering algorithm (POPTICS), the researchers can identify exactly where demand for specific cultures (like gyms vs. museums) outstrips supply, providing a surgical tool for urban planners.
The Problem: Planning for People, Not Just Numbers
Most city planning is static. Planners look at a map, see high population density, and build a park. However, this ignores the behavioral diversity of citizens. A neighborhood of "Gym Lovers" has different needs than "Museum Lovers," and these needs change based on the time of day and season.
Previous research using Topic Modeling often treated check-ins like words in a document but ignored the Temporal Dimension. If you don't know when people visit a concert hall, you can't fully understand the "Music Fan" pattern.
Methodology: The Fusion of Time and Space
1. TLDA: Beyond "Bag-of-Checkins"
The authors extended the standard LDA. In TLDA, a "cultural pattern" isn't just a cluster of venues; it's a probability distribution across Users, Time, and Venue Categories.
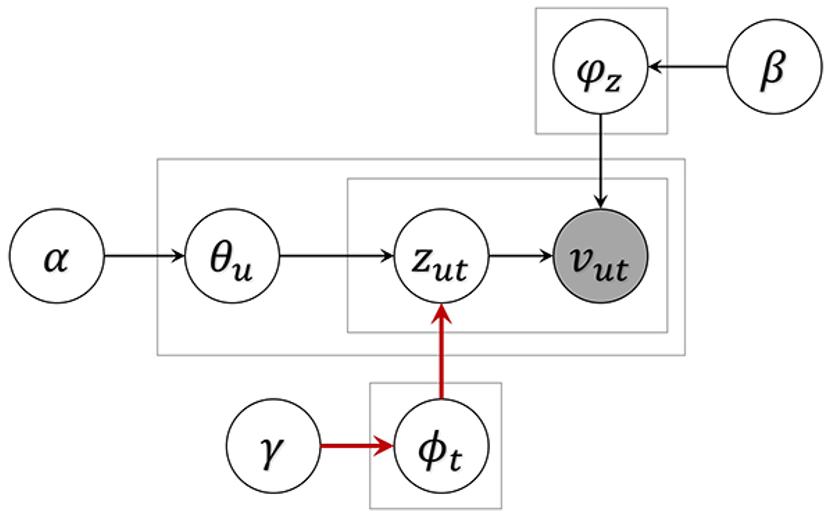
- The Intuition: A specific pattern (e.g., Pattern 1: Nature Lovers) is defined by high probabilities for "Parks/Scenic Spots" (Venue) occurring in "Mornings" (Time) by a specific subset of "Early Risers" (Users).
2. POPTICS & DSI: Measuring the Gap
To move from patterns to planning, the authors needed to define Demand and Supply:
- POPTICS: A personalized version of the OPTICS algorithm that identifies a user's "activity center" without forcing a one-size-fits-all density threshold.
- Demand-Supply Interaction (DSI): Using a Gaussian decay function, they modeled how demand for a culture radiates from a user's center and how a venue's supply radiates from its location.
- DSR (Demand-Supply Ratio): The final metric. A high DSR indicates a "Cultural Desert" for that specific lifestyle.
Experimental Insights: Beijing's 6 Cultural Shades
Using data from 18,234 "Cultural Fans" and over 324k check-ins, the model converged on 6 latent patterns:
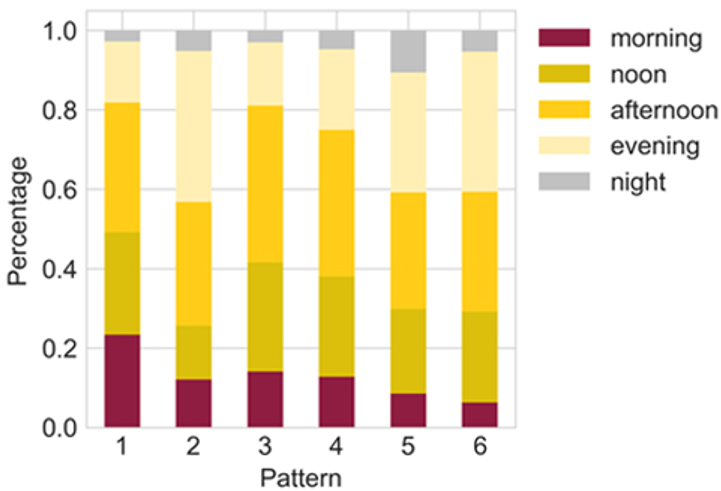
- Nature Lovers: Morning-heavy, active in parks.
- Music Fans: Evening/Weekend-heavy, centered on concert halls.
- Animal/Plant Lovers: Daytime specific.
- Museum Lovers: Afternoon peaks, rarely active on Mondays (when museums close).
- Sports Fans: High nighttime activity (swimming).
- Gym Lovers: Highly focused on a single venue type, active in evenings.
Validating the "Pain": Travel Distance
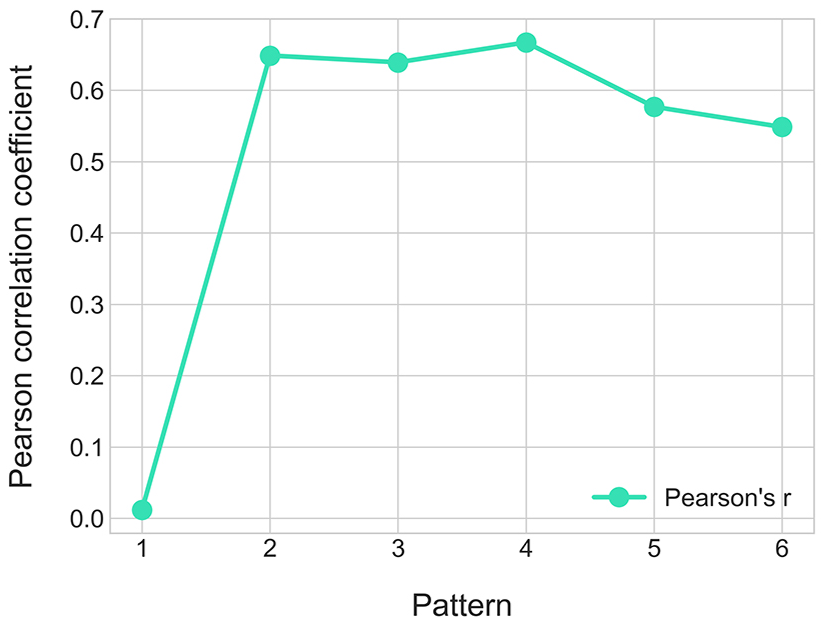
Does a high DSR actually mean people are underserved? The authors found a strong positive correlation (up to 0.79 for some patterns) between DSR and travel distance. People living in high-DSR areas for "Gyms" actually traveled significantly further to reach one, proving the physical lack of local resources.
Critical Analysis & Conclusion
The Takeaway: This work shifts urban computing from describing what is to prescribing what should be. By mapping the Demand-Supply Ratio, city officials can prioritize investments in high-DSR grids to reduce travel times and improve quality of life.
Limitations:
- Demographic Bias: While WeChat has high coverage, it still leans towards a digitally active population.
- Incentive Bias: People "check-in" to places they want to show off. A visit to a prestigious museum is more likely to be recorded than a routine trip to a neighborhood community center.
Future Outlook: This framework is not limited to culture. It could be applied to healthcare, retail, or public transport planning, creating a truly adaptive city that evolves with the digital traces of its inhabitants.