
Urban Planning via the Social Lens: Can LBSN Data Replace the Census?
Could Data from Location-Based Social Networks Be Used to Support Urban Planning?
The paper investigates the viability of using data from Location-Based Social Networks (LBSNs) like Facebook, Foursquare, Google, and Yelp to support urban planning. By calculating the Local Availability Index (IOL) for Belo Horizonte, Brazil, it demonstrates that crowdsourced POI data can serve as a near real-time proxy for official urban quality-of-life indicators.
TL;DR
This research explores whether the digital footprint we leave on platforms like Foursquare, Facebook, and Google can assist city governors in urban planning. By replicating the Local Availability Index (IOL)—a core component of the Quality of Urban Life Index—using crowdsourced POIs (Points of Interest), the authors prove that social data can provide high-accuracy insights into urban service distribution, effectively "nowcasting" the city's health between infrequent official censuses.
Background & Motivation: The "Staleness" Problem
Efficient urban planning requires fresh data. However, official indices like the IQVU (Indice de Qualidade de Vida Urbana) are notoriously difficult to maintain. In Belo Horizonte, updates often lag by 4 to 6 years because gathering data from various government silos is slow, politically charged, and technically inconsistent.
The authors' insight is simple yet profound: If citizens are already mapping the city through their daily check-ins and business reviews, why not use that "living" data to supplement official records?
Methodology: Mapping Social Pixels to Urban Indicators
To test this, the researchers focused on the Local Availability Index (IOL). The IOL calculates how many services (hospitals, schools, parks) are available per thousand inhabitants in specific Planning Units (UPs).
1. Data Harvesting
They deployed crawlers across four platforms: Facebook Places, Foursquare, Google Places, and Yelp. To ensure no POI was missed, they used a high-resolution grid of 530,044 reference points across the city.
2. The Normalization Formula
The IOL uses a specific exponential decay formula to normalize the raw count of services, preventing outliers (like a single block with 50 pharmacies) from skewing the results: Where is a factor derived from the 95th percentile of service density. This ensures that the index reflects sufficient access rather than just raw volume.
3. Category Mapping
The biggest challenge was translating "Social Media Speak" into "Urban Planning Speak." For example, mapping a "Casual Dining" tag on Yelp to the "Food Supply" indicator in the IQVU.
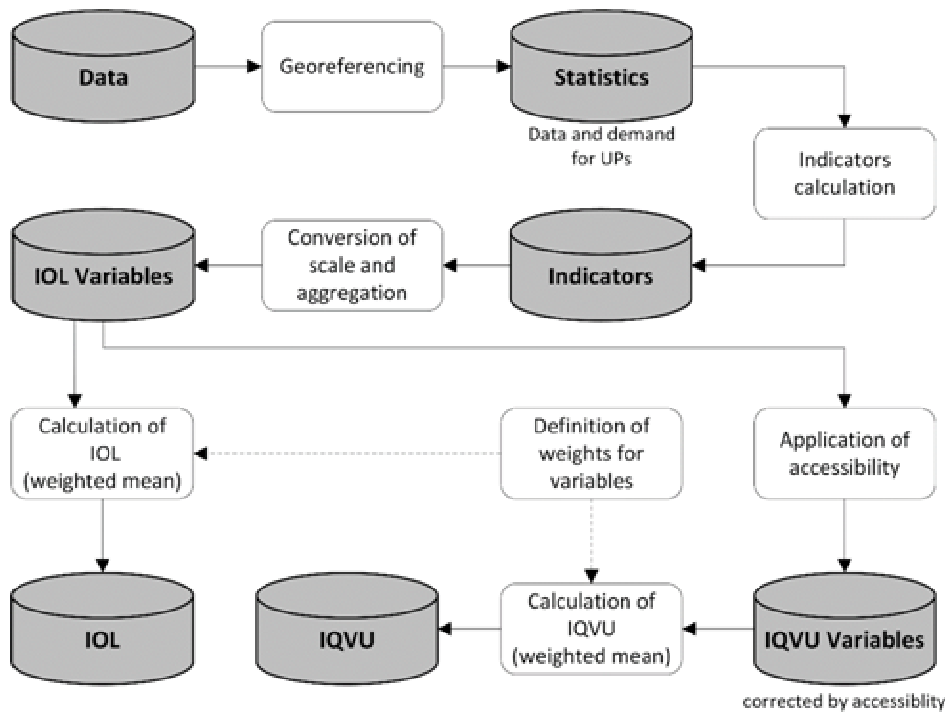 Figure 1: The pipeline from raw LBSN data to a normalized urban quality index.
Experiments and Spatial Insights
The study compared LBSN-derived results against official 2012 government data.
- Performance: Yelp emerged as a surprising leader in accuracy for specialized services like healthcare and green areas.
- Spatial Patterns: While LBSN data is densest in the city center (a known bias), it successfully captured the "Food Supply" patterns across different neighborhoods.
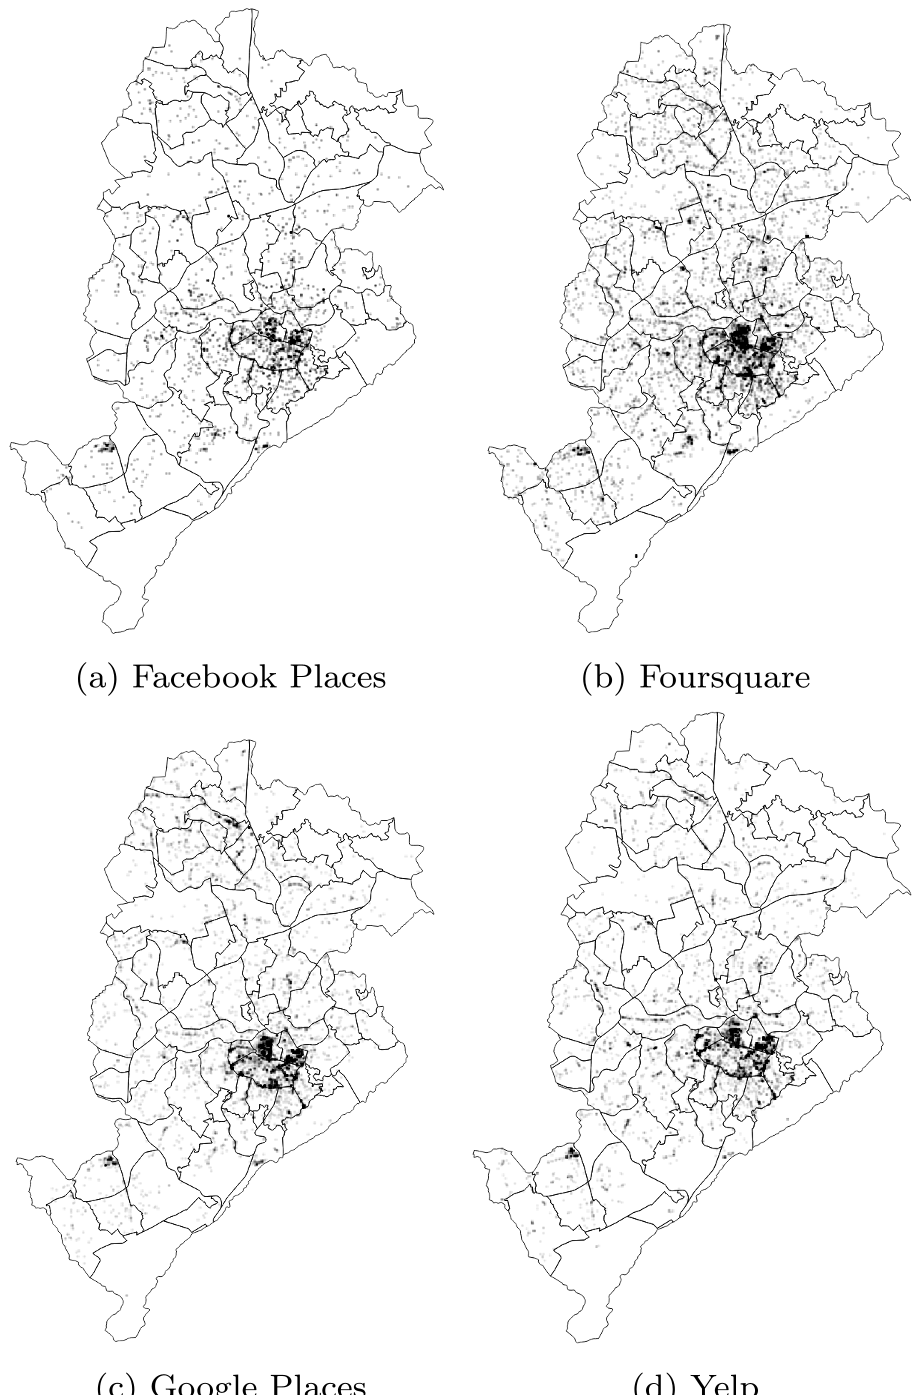 Figure 2: Comparison of POI density across different LBSNs. Note the concentration in the central business districts.
The Comparison Map
The visual comparison of the "Food Supply" variable shows that while LBSNs (Foursquare specifically) are more "sparse" than official records, the relative hot-spots and deprived zones remain consistent across sources.
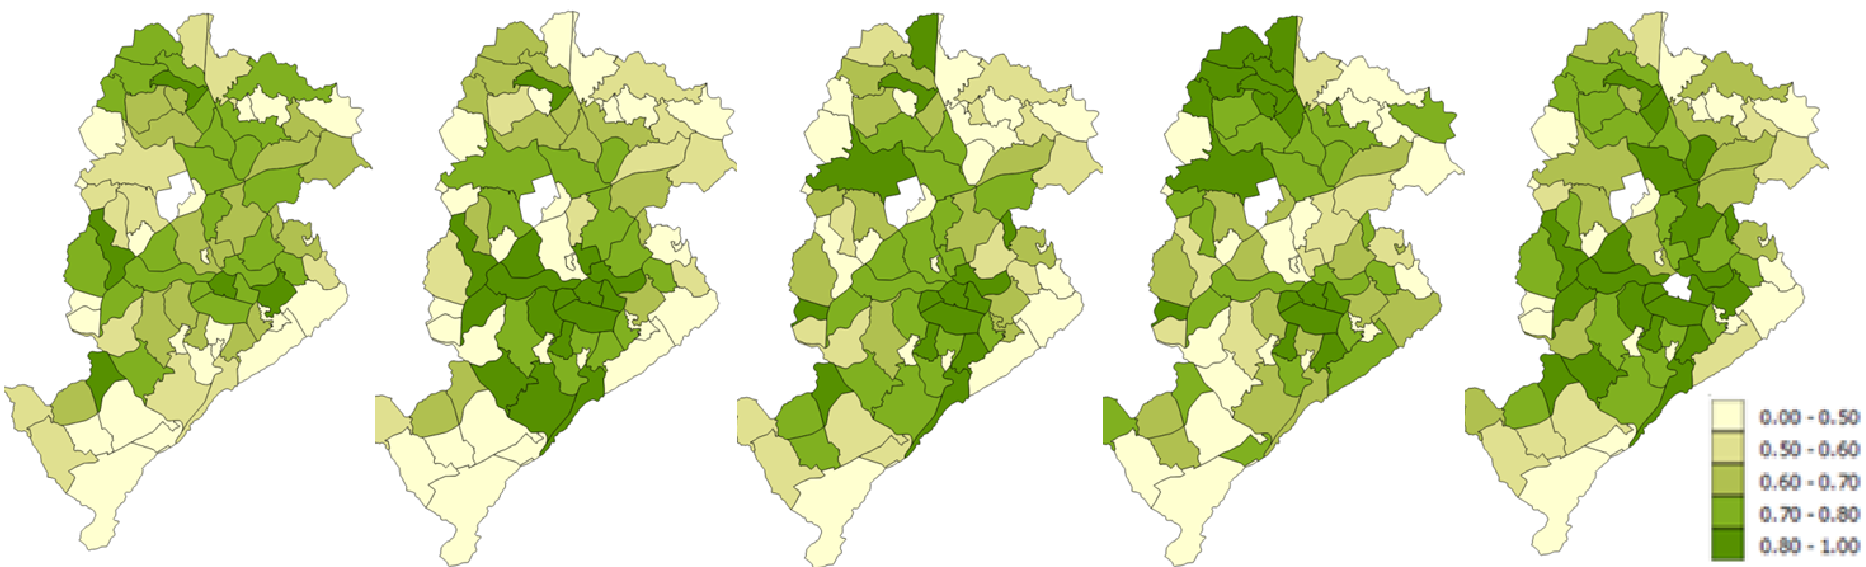 Figure 3: Side-by-side comparison of Official 2012 Data vs. LBSN-derived Food Supply maps.
Critical Analysis & Conclusion
The Crowdsourcing Bias
The elephant in the room is Selection Bias. LBSN users tend to be younger, tech-savvy, and more affluent. This means a lack of POIs in a slum on Foursquare might reflect a lack of users, not a lack of services. However, as smartphone penetration reaches near-ubiquity, this gap is closing.
The Takeaway
The paper concludes that while LBSNs shouldn't replace the census, they are invaluable for Nowcasting. Instead of waiting five years to realize a neighborhood has become a "food desert," planners can use social data to flag issues in real-time.
Future Work: The authors highlight the need for better deduplication (recognizing that "Joe's Coffee" on Yelp is the same as "Joe's Cafe" on Google) and the integration of Volunteered Geographic Information (VGI) to capture the subjective perception of urban life.