
Emotions Make Cities Live: Bridging the Digital Divide in Urban Psychogeography
17153_Emotions make cities live towards mapping emotions of older adults on urban space.
The paper introduces a specialized mobile crowdsourcing platform designed to map the emotional responses of older adults (65+) toward urban spaces using the Plutchik Wheel of Emotion (PWE). By combining explicit and implicit tagging of geo-located images, it aims to integrate the "missing voice" of the elderly into smart city planning and participatory budgeting.
TL;DR
This research tackles the "demographic silencing" of older adults in smart city data collection. By developing a tablet-based platform rooted in Robert Plutchik's psychological framework, the authors enable seniors to map their emotional connections to urban environments, ensuring their perspectives influence future city planning and participatory budgeting.
Positioning: This work is a SOTA Social Design contribution that bridges Human-Computer Interaction (HCI) with urban sociology, focusing on digital inclusion for an aging population.
The Problem: The Invisible Citizen in the Smart City
Most "Smart City" initiatives are built on the backs of digital natives. We scrape Twitter for sentiment and Instagram for aesthetic "hotspots," but in doing so, we create a data bias. Older adults (65+) are often absent from these datasets, not necessarily due to a lack of skill, but because mainstream social media feels like an unwelcoming "space." Without their input, urban planning risks becoming "scenography"—a city that looks good on paper but doesn't serve its most vulnerable residents.
Methodology: Mapping Affect to Space
The heart of the solution lies in Plutchik’s Wheel of Emotion (PWE). The authors chose this 1980s psychological model because it simplifies the vast spectrum of human feeling into eight primary, bipolar emotions (Joy vs. Sadness, Anger vs. Fear).
1. The Interaction Model
The platform operates in two distinct modes:
- Polling-like approach: Users react to pre-selected images provided by city planners.
- Behavioral approach: Users take photos of their surroundings and "geo-tag" them with their current emotional state.
2. Design for Inclusion
Recognizing the hardware limitations for elderly users, the team developed a tablet-optimized interface.
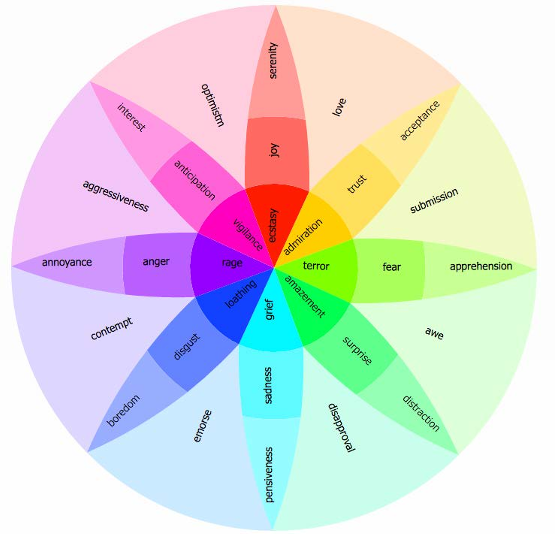 Figure 1: The Plutchik Wheel serves as the primary UI element for data entry.
The app supports two interaction patterns:
- Drag-and-Drop: Natural for more tech-savvy seniors.
- Direct Click: A fallback for those with minor motor impairments or less confidence in touch gestures.
Experimental Insights & Results
The pilot study involved participants aged 63-68. The initial findings provide a reality check for urban data scientists:
- Screen Size Matters: Anything smaller than a 9-10 inch tablet was deemed unusable for this demographic due to sight and precision issues.
- The "Crowded Screen" Fallacy: Users struggled with interfaces that kept past evaluations on-screen, suggesting that "atomic tasks" (one image, one emotion, then clear) are superior for senior UX.
- External Constraints: Unlike younger "digital nomads," the activity levels of older adults drop significantly in bad weather (slippery pavements, rain), meaning urban emotion maps for this demographic may be seasonally biased.
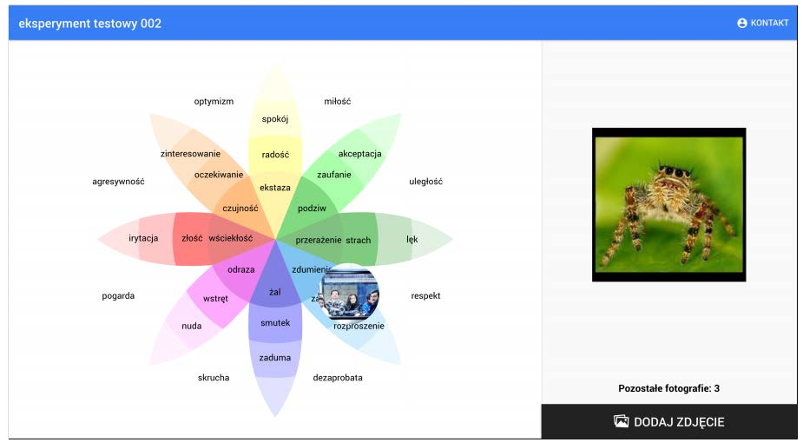 Figure 2: The UI layout—simplicity and large touch targets are prioritized over information density.
Critical Analysis & Conclusion
Takeaway
The study proves that older adults can and want to participate in the digital life of their cities if the tools are designed with Inductive Bias toward their specific needs. Emotional tagging is a powerful, low-cognitive-load method for gathering high-quality qualitative data.
Limitations
- Scalability: The reliance on high-end tablets (10 inch) makes large-scale deployment expensive compared to smartphone-based crowdsourcing.
- Safety: In developing regions, the physical act of taking out a tablet in public poses a theft risk, a barrier that software design alone cannot solve.
Future Outlook
The next phase involves creating a literal "Emotion Map of Warsaw," where monuments and public projects are evaluated not by their architectural merit, but by the joy or fear they evoke in the city’s elders. This moves us closer to a "Life-Centric" urbanism where data is humanized.