
Unmasking the Power Structure: Inferring Latent Hierarchies in Social Networks
Inferring the Maximum Likelihood Hierarchy in Social Networks
This paper introduces a novel maximum likelihood framework and the "Hi-GreeMax" algorithm to infer latent social hierarchies from weighted, undirected networks. It treats hierarchy as a probabilistic generative model, successfully recovering organizational structures in both simulated environments and real-world political datasets (Bush and Obama administrations).
TL;DR
Researchers from the University of Illinois at Chicago have developed a robust probabilistic framework and an algorithm called Hi-GreeMax to uncover hidden hierarchies within weighted networks. By treating hierarchy as a generative model rather than a simple ranking, the approach can reconstruct complex organizational charts even when only undirected "who talks to whom" data is available.
Motivation: The Blind Spots of Centrality
From corporate boardrooms to biological populations, hierarchy is the "hard-wired" architecture of social groups. However, for an outside observer—or an intelligence analyst—the formal organizational chart is often hidden.
Prior work typically relied on Centrality Measures (like Degree or Eigenvector centrality). The assumption was simple: the boss is the most central node. But this isn't always true. In a "Manager-Driven" model, a middle manager might have more interactions than a shadowy CEO. The authors argue that we need a more flexible approach that accounts for how different groups interact.
Methodology: Hierarchy as a Generative Model
The core insight of this paper is that hierarchical position dictates interaction probability. As the "tree distance" between two individuals increases, their likelihood of interacting decreases.
The researchers defined four candidate Interaction Models:
- Direct Model: Interactions only occur between parents and children.
- Distance Model: Interactions decay as you move further apart in the tree.
- Manager-Driven: Team members only interact through their manager.
- Team-Driven: Siblings (peers) interact more frequently than they do with their bosses.
The Hi-GreeMax Algorithm
To find the most likely hierarchy (which is computationally "NP-Hard" to solve by brute force), the authors proposed Hi-GreeMax. This algorithm builds the tree greedily:
- It starts with a "seed" node (highest weighted degree).
- It uses FindMaxTriad to establish the initial 3-node configuration from ten possible "triad" shapes.
- It iteratively places remaining nodes in positions that maximize the total log-likelihood of the structure.
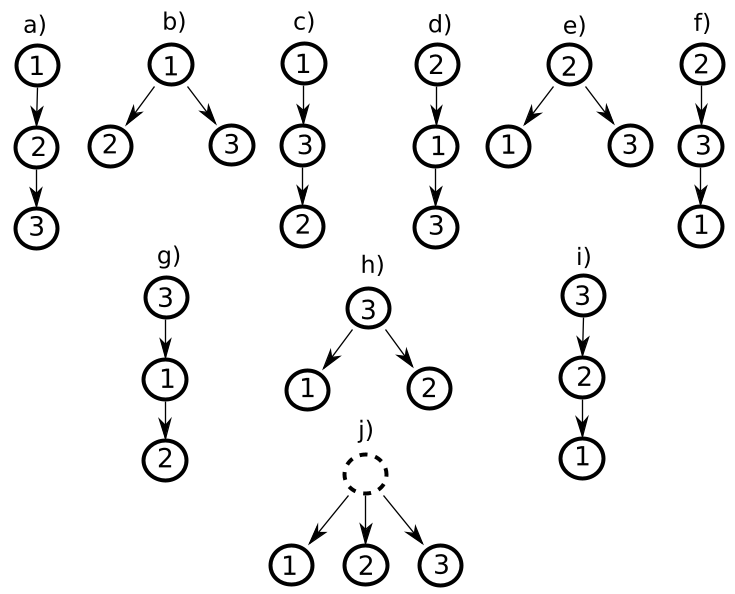 Figure 1: The building blocks of the hierarchy—ten possible configurations for three nodes.
Experimental Validation
1. Simulated Success
In simulations involving up to 250 nodes, the algorithm achieved a perfect recovery rate. Notably, it not only found the correct tree structure but also correctly identified which of the four interaction models was used to generate the data (e.g., identifying a "Team-Driven" network vs. a "Direct" one).
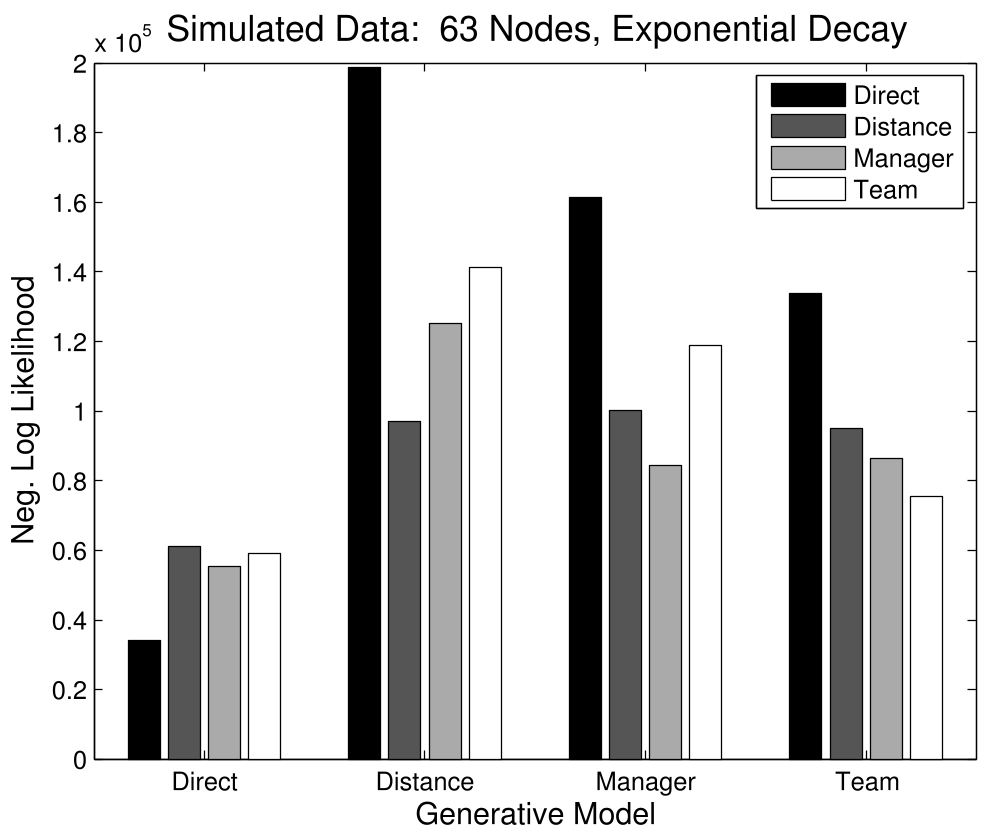 Figure 2: Lower scores indicate a better fit. The "true" model always yielded the lowest negative log-likelihood.
2. Real-World Case Studies: Bush and Obama Administrations
The authors applied the model to data derived from Google search results (e.g., how often "Person A" and "Person B" appear near each other).
- The Obama Hierarchy: By using word proximity and title filtering, the model perfectly reconstructed the administration's structure, identifying the "Manager-Driven" model with inverse linear decay as the best fit.
- The Bush Hierarchy: While mostly accurate, the model struggled with "noisy" data (e.g., Paul Wolfowitz appearing more linked to Bush than his actual boss, Donald Rumsfeld, in public text). This highlighting the importance of data quality in social network analysis.
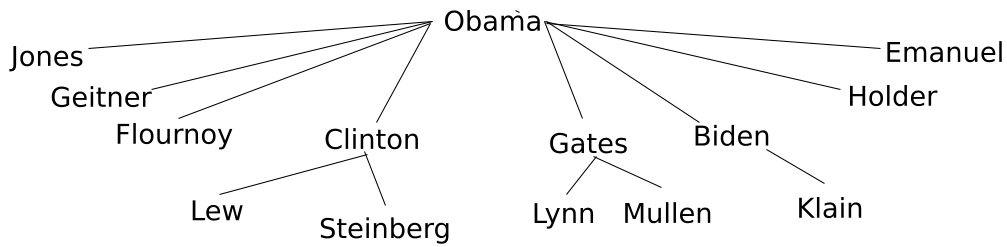 Figure 3: The inferred structure for the Obama administration, successfully identifying the President at the root.
Critical Insight & Conclusion
This work shifts the paradigm from "detecting rank" to "modeling interactions." Its greatest strength is its flexibility; unlike previous biological or sociological methods, it doesn't care if the network is undirected or if the hierarchy is non-linear.
Future Outlook: The authors suggest that future models should incorporate "level-dependent" probabilities—for instance, acknowledging that interactions at the "VP level" might look different than those at the "Intern level." As we move into an era of massive metadata, tools like Hi-GreeMax will be essential for understanding the latent structures that govern human and machine societies.