
Foursquare Unveiled: A Comprehensive Measurement of Global Tip Sharing and User Happiness
Measurement and analysis of tips in foursquare
This paper presents a large-scale, unbiased empirical study of "tips" (micro-reviews) on Foursquare, analyzing a dataset of 6.52 million users. The authors characterize tip distribution using a two-term exponential model and introduce the "Happiness Index" to quantify user satisfaction across different venue categories and demographics.
TL;DR
As Foursquare transitioned from a check-in-centric app to a discovery-focused platform, the role of "tips" (micro-reviews) became paramount. This study analyzes 6.52 million users and millions of tips to reveal who writes them, where they are happiest, and how tip-posting behavior follows a strictly predictable (yet highly unequal) mathematical distribution.
Context: Beyond the Check-in
Historically, researchers viewed Foursquare through the lens of mobility and social graphs—asking "where do people go?" and "who are they with?". However, after Foursquare spun off its check-in feature into Swarm in 2014, the core app became a repository of local knowledge. This paper identifies a critical gap: we don't actually know much about the "Tips" that now power the platform's value.
The authors argue that previous studies suffered from Selection Bias—by only crawling users who were active, they ignored the "silent majority." By using a sequential ID crawling method, this study captures the first truly representative snapshot of the Foursquare ecosystem.
Methodology: The Math of Participation
The authors find that participation is not just unequal; it follows a specific mathematical signature. While many social phenomena follow a Simple Power Law, Foursquare tips are best described by a Two-term Exponential Model.
The 1% Rule of Micro-Reviews
- The Inactive Majority: 83.47% of users are "lurkers" or readers who have never published a single tip.
- The Power Users: The top 1% of users are responsible for nearly half (47.54%) of the platform's entire content library.
- Gender and Identity: Interestingly, users who upload profile photos are significantly more active (1.28 tips avg) than those who don't (0.09 tips avg), suggesting that platform "investment" correlates with content contribution.
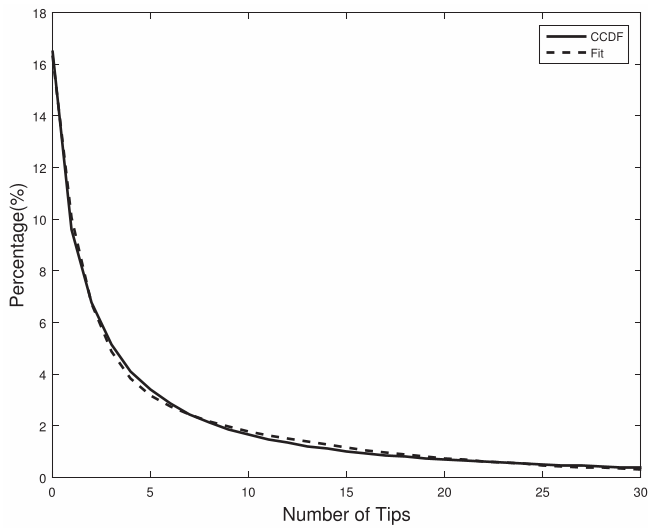 Fig 1: The distribution shows a steep drop-off, typical of digital participation, fitting the two-term exponential model ().
Spatial and Temporal Dynamics
Where and when do people leave tips?
- Category Dominance: "Food" is king, accounting for 45.06% of all tips. If you aren't eating, you aren't writing.
- The Pivot Effect: The data shows a clear peak in tips during Q3 2014—exactly when Foursquare forced the transition to the new tip-centric interface.
- Global Diversity: Using "Venue Country Entropy," the authors prove that Foursquare's footprint expanded rapidly until 2012, after which its geographic diversity reached a steady state.
The Happiness Index: Quantifying Satisfaction
The most innovative part of the study is the "Happiness Index" (). By processing English tips through TextBlob, the authors mapped sentiment to a 0-1 scale.
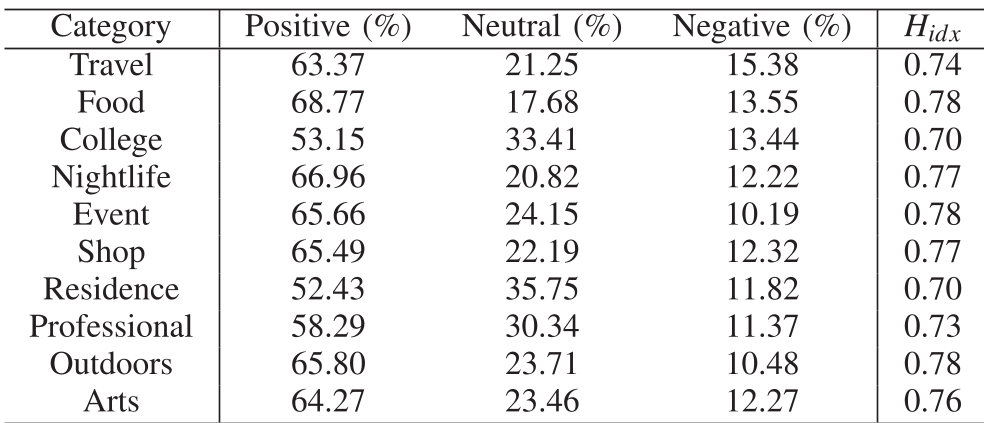 Table 1: Happiness Index across categories. Note that "Food" and "Outdoors" score highest, while "College" and "Residence" reflect lower satisfaction.
Key Insights from Sentiment Analysis:
- Positivity Bias: 65.72% of tips are positive. People generally use Foursquare to recommend what they like, rather than just complain.
- Geographic Variation: Brazilian users are the "happiest" on the platform (Hidx 0.80), whereas Indonesian users post more neutral/conservative reviews (Hidx 0.75).
- Gender Trends: Male users recorded a slightly higher Happiness Index (0.77) than female users (0.75).
Critical Analysis & Future Outlook
Contribution: This paper provides a baseline for understanding UGC in LBSNs. It moves beyond simple "count" metrics into the territory of "affective computing"—understanding the emotional pulse of a city.
Limitations: The sentiment analysis was limited to English-language tips. Given that Turkey, Indonesia, and Brazil are top markets for Foursquare, a significant amount of nuances in local languages (Turkish, Portuguese, etc.) might be missed.
Future Work: The authors suggest that the next frontier is Spam Detection. As tips become the primary signal for venue ranking, the incentive for business owners to post "fake positive" tips grows, necessitating robust machine-learning models to ensure platform integrity.
Conclusion
This Foursquare measurement study confirms that while content creation is a "top-tier" activity reserved for a few, the resulting data provides a rich, emotionally-coded map of the world. For venue owners, the message is clear: focus on "Food" and "Events" to trigger the highest volume of positive micro-reviews.